
Tags
Central registry of every data point the application monitors — configure data types, scaling, logging, alarm limits, and units for each tag.
On this page
The Tag Database is the core data model of the application. Every data point collected from connected devices is represented here as a named tag. Tags are the universal currency of the project — they appear in reports, trigger alarms, feed historical logs, and bind to chart and table elements throughout the application.
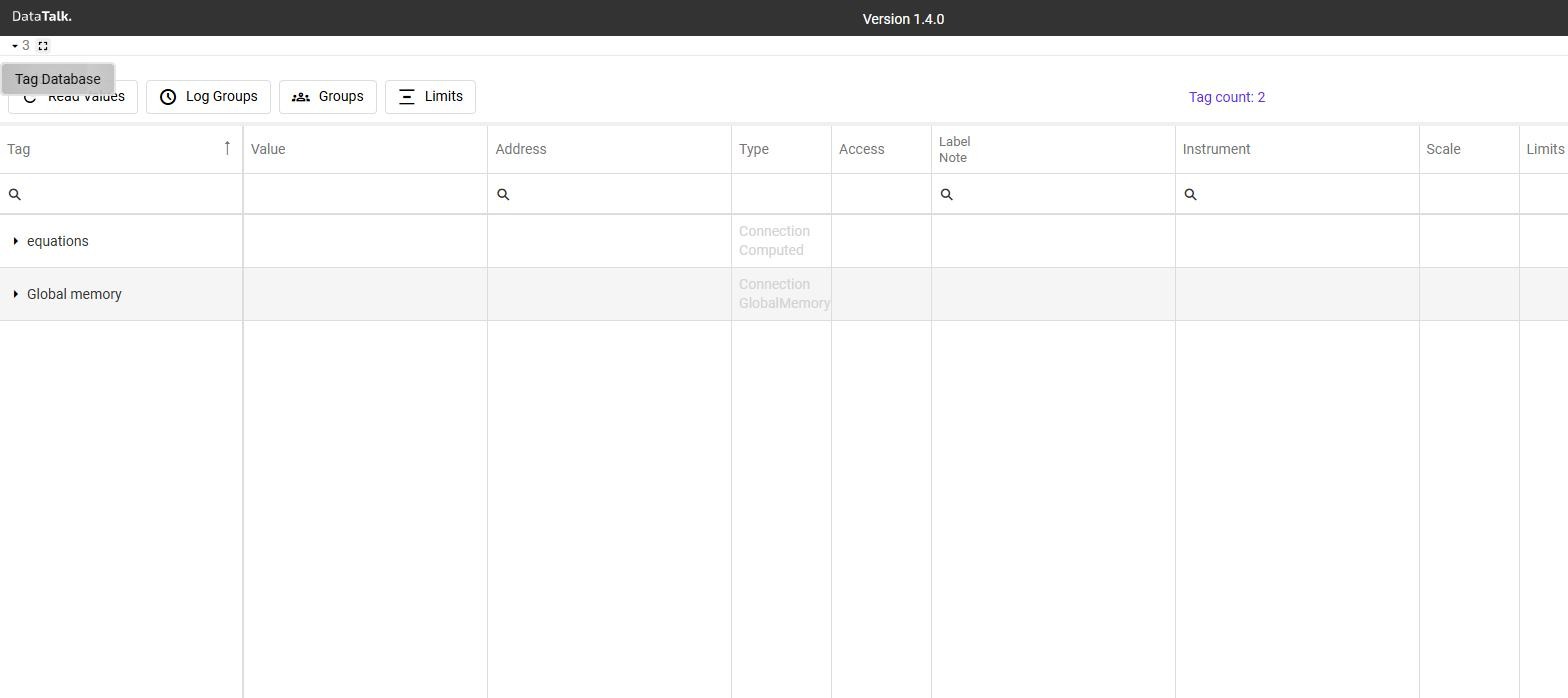
Page tabs
The Tag Database is divided into tabs, each focused on a different aspect of tag configuration:
Read Values — displays the current live value for every tag, refreshed automatically; the fastest way to verify that a new connection is reading data correctly.
Log Groups — assign tags to historical logging groups and configure the sampling interval for each group.
Groups — organize tags into named groups for filtering and group-level access control.
Limits — assign alarm threshold sets to individual tags.
Each license includes a maximum number of tags. The current count and the license limit are shown in the page header.
Tag properties
Each tag has one read-only display field — Value — which shows the current live reading from the device and updates each polling cycle. The remaining properties are configurable and fall into four groups.
Identification
These properties control how the tag is named and found across the system. Tag is the internal identifier used in formulas and cross-references; Label / Note is what operators see in reports and the alarm panel.
Tag — Unique identifier within the project (e.g., Pump1_Speed, Hall_A_Temp). Used in report bindings and cross-references — choose names that are stable and self-explanatory.
Label / Note — Human-readable description shown in report elements instead of the raw tag name. Add language-specific fields here if multiple languages are configured in the project.
Instrument — Physical instrument designation from the P&ID or asset register (e.g., TE-101, FT-204). Free-text reference field that does not affect data acquisition. Use it to cross-reference tags to physical instrument documentation.
Unit — Engineering unit displayed alongside the value (e.g., °C, bar, kW, m³/h, rpm, %). Set this after configuring Scale so the displayed unit matches the scaled output.
Categories — One or more category labels for filtering, configured in Categories. Assign categories to keep large tag lists navigable when working in the report designer or alarm panel.
Data source
These properties tell the application where to read the tag’s value. Address must match the device’s register map exactly; Type must match what the device actually sends — a mismatch produces garbage values or a read error.
Address — Register address on the device in the protocol’s native format (e.g., %MW100 for Modbus holding register 100). Refer to the device’s documentation or I/O list to find the correct address.
Type — Data type: INT16, INT32, UINT16, FLOAT, BOOL, STRING, and others depending on the protocol. Set this to match exactly what the device transmits — wrong types cause silent misreads.
Gateway — Which Connection (device) provides this tag’s data. Change this to reassign a tag to a different device without recreating it.
Value processing
These properties transform the raw device value before it appears anywhere in the system. Scale converts raw device units to engineering units; Format controls how many decimal places are shown.
Access — R = read-only. RW = read/write. Set to RW when operators need to write values to this tag from report views — leave as R for sensor inputs that should never be overwritten.
Scale — Linear transformation applied to the raw device value before storage: displayed value = raw × scale + offset. Use this to convert ADC counts or other device-native units to engineering units. Leave at default (scale 1, offset 0) if the device already sends engineering values.
Format — Display formatting: number of decimal places and formatting pattern (e.g., #0.00 for two decimal places). Affects how the value appears in reports and the alarm panel, not the stored precision.
Monitoring and logging
These properties determine what happens with the tag’s value over time. Limits activates threshold-based alarming; Log controls whether historical data is kept — without this enabled, no history is recorded for the tag.
Limits — Name of the alarm Limits set assigned to this tag, configured in Ranges & Limits. Assign a Limits set to enable threshold-based alarms; leave blank if no alarming is needed for this tag.
Log — Whether the tag value is recorded to the historical datalog, and which log group it belongs to. All production measurement tags should be logged — without this enabled, no history is available for report charts and tables.
Adding tags
Tags can be added in several ways depending on the protocol:
EtherNet/IP supports online import directly from the PLC’s tag database as well as import from .L5X project export files. OPC UA supports online browse — select nodes from the device’s address space without knowing node IDs in advance. Modbus does not support automatic import — addresses must be entered manually based on the device’s register map.
Click Add and fill in the tag name, address, data type, and connection. Suitable for all protocols but requires knowing the register address in advance. Standard approach for Modbus.
For OPC UA connections, use the Browse function to connect to the device and select nodes from its address space directly — no need to know node IDs in advance.
For Allen-Bradley connections, import tags directly from the PLC’s tag database online. Also supports import from .L5X export files.
Import a prepared CSV file with tag definitions — useful for large projects or migrating from another system.
Real-time values
The Read Values tab shows the current live value for every tag. Values update automatically — no manual refresh needed. This tab is the fastest way to verify that a new connection is working correctly and that addresses are mapped to the expected signals.
Log groups
Tags assigned to a log group are sampled at the group’s configured interval and stored in the historical datalog. Define multiple groups with different intervals — for example, a fast group at 1 s for critical process variables and a slow group at 15 min for utility meters.
Charts and table elements in the report designer can only display data from logged tags. Enable logging for any tag you may want to include in a report — even if you are not sure yet. Storage is cheap; missing historical data cannot be reconstructed.
A tag’s historical values are only kept if Log is checked and the tag is assigned to a log group. Tags without logging enabled have no historical record — only the current live value is available.
What is a tag?
A tag in a SCADA system represents a programmatic variable tied to a physical or virtual data source, typically a PLC register or sensor output. Each tag carries three core pieces of information at every moment:
Value — The current data read from the source, such as a temperature reading, motor speed, or valve position.
Timestamp — The exact time when the value was last recorded or confirmed by the polling cycle.
Quality — An indicator of how reliable the current value is. Good quality means the device responded correctly; Poor or Bad quality signals a communication failure or device error, and the displayed value should not be trusted.
Tags are the universal building block of a DataTalk project. They appear in reports and dashboards, trigger alarms when their value crosses a Limits threshold, and feed historical log groups.
Tag column quick reference
Value — displays the live value read from the device when Read Values is active.
Address — the data point’s address on the device in the protocol’s native format.
Type — data type of the tag (e.g., INT16, FLOAT, BOOL, STRING).
Access — read/write permissions: R for read-only, RW for read-write.
Label — human-readable description; additional language fields appear when multiple languages are configured.
Scale — linear transformation applied to the raw device value (multiplied, then offset added).
Limits — name of the alarm Limits set assigned to this tag.
Log — whether historical values of the tag are recorded; if not enabled, no history is kept.
Log Groups — assigns the tag to a named log group with a configured sampling interval.
Unit — engineering unit shown alongside the value (e.g., °C, kPa, kW).
Format — display format pattern controlling decimal places (e.g., #0.00 for two decimal places).
Gateway — the Connection (device) that provides this tag’s data.