
Alarms
The Alarms view embeds a live alarm table into a dashboard, letting operators monitor active alarms alongside process charts and gauges on the same screen.
On this page
The Alarms view under Visuals provides a dashboard-embeddable alarm table. It displays the same active alarms as the main DataTalk alarm system — there is no separate alarm database — but in a component that can be placed directly onto a dashboard canvas alongside charts, gauges, and other process visuals.
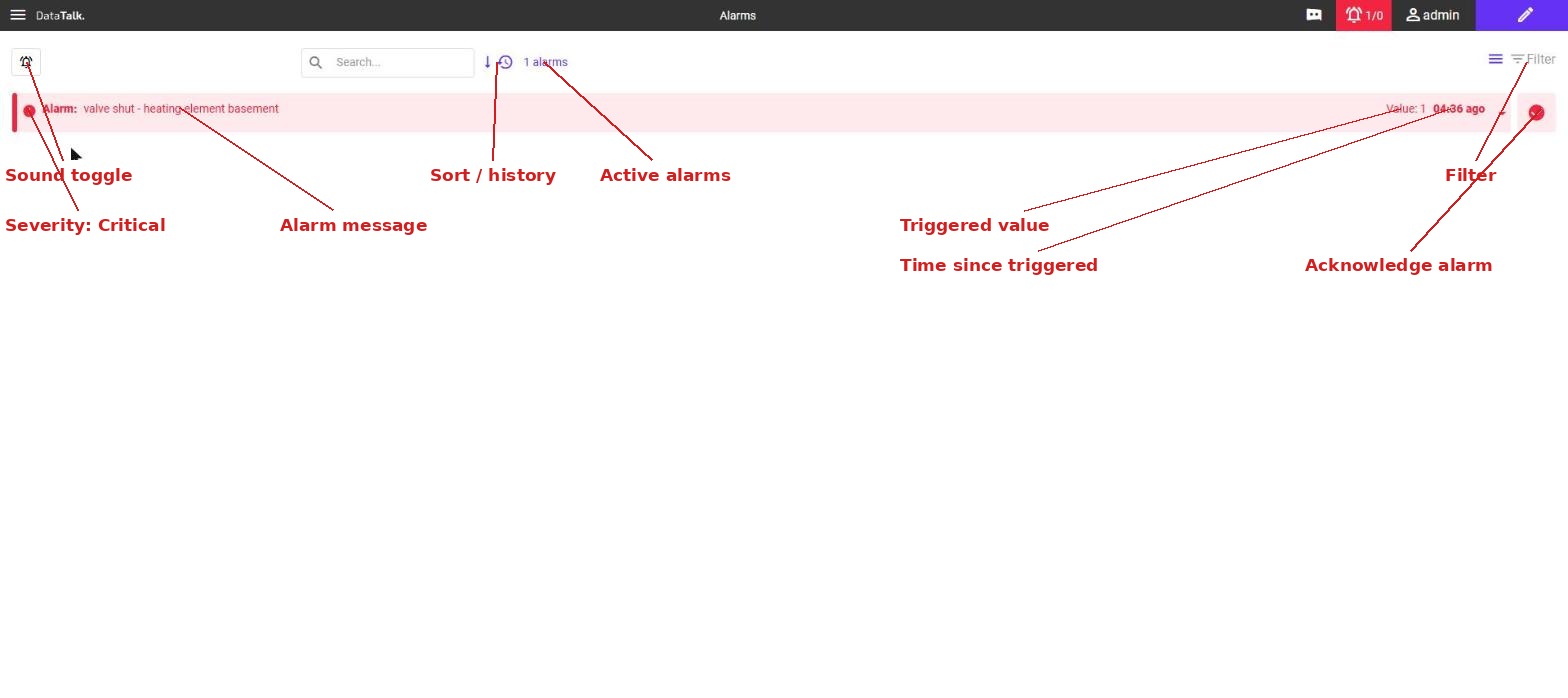
Each alarm row shows:
Severity: Critical — the red indicator on the left identifies the alarm’s severity level (Critical, High, Medium, Low).
Alarm message — the configured alarm name and description, for example “valve shut – heating element basement”.
Triggered value — the tag value that caused the alarm to activate.
Time since triggered — how long the alarm has been active (e.g. 04:36 ago).
Acknowledge alarm — the checkmark button marks the alarm as seen by the operator. Acknowledged alarms may still be active; acknowledging only records that the operator was notified.
The toolbar above the list provides:
Sound toggle — mutes or unmutes the audible alarm notification.
Sort / history — switches between sorting active alarms and viewing historical alarm records.
Active alarms — displays the count of currently active alarms (e.g. 1 alarms).
Filter — opens filter options to restrict the list by severity, category, or acknowledgement status.
This makes it practical to build operator screens where a single display shows both live process values and the current alarm state, without requiring the operator to switch between separate applications or browser tabs.
Opening the alarm view configuration
In the left sidebar (Project mode), expand Visuals → Alarms. Double-click the Alarms item to open its configuration in the editor.
Configuration options
Alarm categories / groups — filter which alarm categories or groups to display. If your system defines alarms by plant area or machine, you can show only the alarms relevant to a specific dashboard’s scope.
Columns — choose which fields to display as columns. Typical columns include timestamp, tag name, alarm message, severity, and acknowledgement status.
Severity filters — restrict the table to specific severity levels (for example, show only Critical and High alarms, suppress Informational entries).
Acknowledged / Active filter — optionally show only unacknowledged alarms, or all alarms within a time window regardless of acknowledgement.
Placing the alarm view on a dashboard
Drag the Alarms item from the Project tree onto a dashboard canvas. Resize it to fit alongside other components. In view mode, the alarm table updates live — new alarms appear as they trigger, and cleared alarms are removed or updated automatically.
Placing an alarm view in the corner or bottom strip of a dashboard gives operators a persistent alarm awareness without leaving the process view. Pair it with a Live Chart of the most critical process variable for a compact, high-value operator screen.