
Storage
Monitor disk usage across project files, historical datalogs, and event logs. Configure storage allocation and adjust datalog retention periods.
On this page
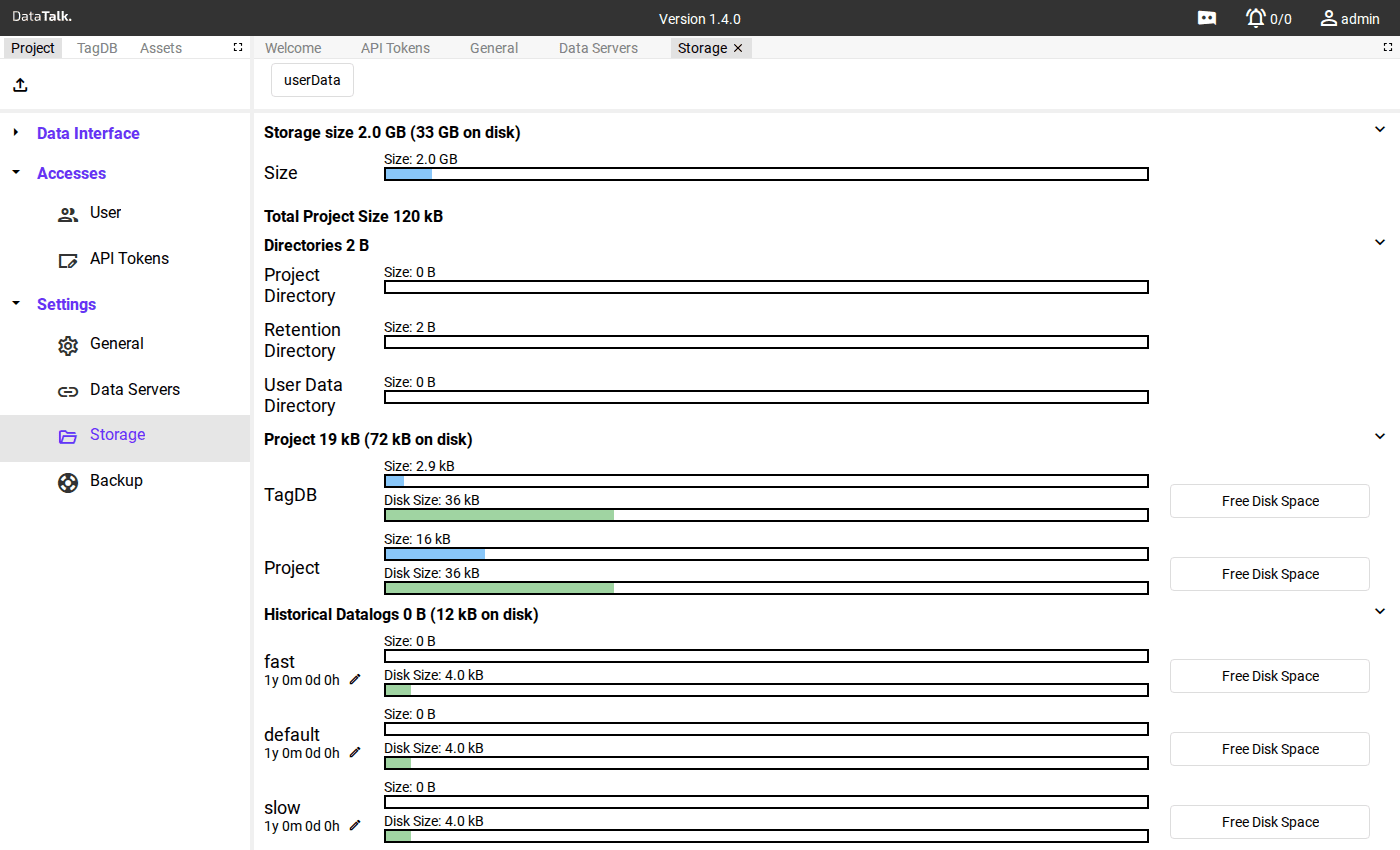
The Storage page shows how much disk space the gateway is using and how it is distributed across different data types. The total storage allocation and the physical disk capacity are shown at the top — actual values depend on the hardware the gateway runs on and the storage size configured for the project.
Storage breakdown
Directories
The Directories section shows disk usage for the three storage locations the gateway manages:
Project Directory — Stores all project configuration: HMI view designs, tag definitions, connections, UDTs, equations, and settings.
Retention Directory — Stores the historical datalogs (log groups). This is typically the largest consumer of disk space in active projects.
User Data Directory — Stores files uploaded via the userData file manager. Size depends on how many files are stored there.
Project files
Two categories of configuration data are tracked under the Project directory: Project (HMI view designs, widget configurations, and project-level settings) and TagDB (tag definitions, UDT templates, and equation scripts). Project files are small by nature — they contain configuration, not time-series data. Growth here happens when views become complex or when many UDTs are defined.
Each item has a Free Disk Space button that removes fragmentation and reclaims unused blocks on the partition — useful after large batch deletes.
Historical datalogs
The gateway creates three datalog groups by default. Assign each tag to the group that best matches how fast its value changes and how long you need to keep the history — this is the main lever for controlling disk usage. Each group has a configurable retention period — shown below the group name as 1y 0m 0d 0h (years, months, days, hours) — and the gateway automatically purges records older than that limit, keeping disk usage bounded.
default — Use for most production tags: process values, setpoints, status flags that change on a human timescale. Typical sampling interval: 1 second – 1 minute.
fast — Use for high-speed signals where sub-second resolution is needed — counters, fast control loops, vibration. Generates the most data; keep retention short. Typical sampling interval: 100 ms – 1 s.
slow — Use for values that change slowly and where long history matters — temperatures, tank levels, energy totals. Generates very little data; retention can be much longer. Typical sampling interval: 1 – 15 minutes.
Tags are assigned to a log group in the Tag Database → Log Groups tab.
Adjusting retention
To change a group’s retention period, click the pencil icon (✏) next to the group name and enter the new duration. Shortening the retention immediately purges records older than the new limit, freeing disk space.
If storage is running low, take these steps in order:
- Shorten the retention period on the
fastgroup first — it generates the most records per day and has the least historical value over time. - Move slowly changing tags from
defaulttoslowto reduce their sampling frequency going forward. - Check whether any tags are being logged that do not need history at all, and disable logging for those tags.
- Use the Free Disk Space button next to each log group to defragment and reclaim unused space on the partition.
Event log
The Event Log tracks system-level activity: connection status changes, application errors, and configuration edits. Its current size and disk footprint are shown in this section.
Operator interventions — who changed which tag to what value and when — are recorded separately as userLog entries, which are only populated when User Interventions is enabled in General settings.
userData file manager
The userData tab (button visible at the top of the Storage page) opens a file manager for the User Data Directory. Use it to store files on the gateway that HMI views can reference — for example custom graphics, PDF manuals, or reference documents for operators.
From the userData file manager you can:
- Browse and navigate the directory tree
- Upload files from your computer using the Upload files button
- Create subdirectories with New directory
- See each file’s Name, Date Modified, and File Size
The Storage page shows both the current data size and the free space remaining for each partition. When a datalog partition fills completely, new incoming records are dropped — older data is kept, but new values are lost until space is freed. Check Storage regularly and adjust retention periods or allocation as needed.
As a rough example: a project with 50 tags sampled at 1-second intervals generates approximately 4.3 million records per day. Your actual rate depends entirely on how many tags you log and at what interval — use this as a starting point, then measure actual growth over the first few days of operation and adjust retention periods to match your available disk.