
Quick start: Modbus to OPC UA
Step-by-step guide — connect a Modbus TCP device, map its registers to named tags, and immediately serve all values via the built-in OPC UA Server to any SCADA or historian.
On this page
This guide walks through a complete end-to-end setup: reading data from a Modbus TCP device and publishing it through the gateway’s built-in OPC UA Server so that any OPC UA-capable client — SCADA system, historian, or engineering tool — can browse and subscribe to live values without touching the device directly.
By the end you will have:
- A Modbus TCP connection polling a device on your network
- Named tags mapped to specific register addresses, scaled to engineering units
- A live OPC UA Server exposing all tags in a browseable address space
Time required: 10–15 minutes.
Step 1 — Add a Modbus TCP connection
In the left panel, expand Data Interface and double-click Connections. The tile view opens.
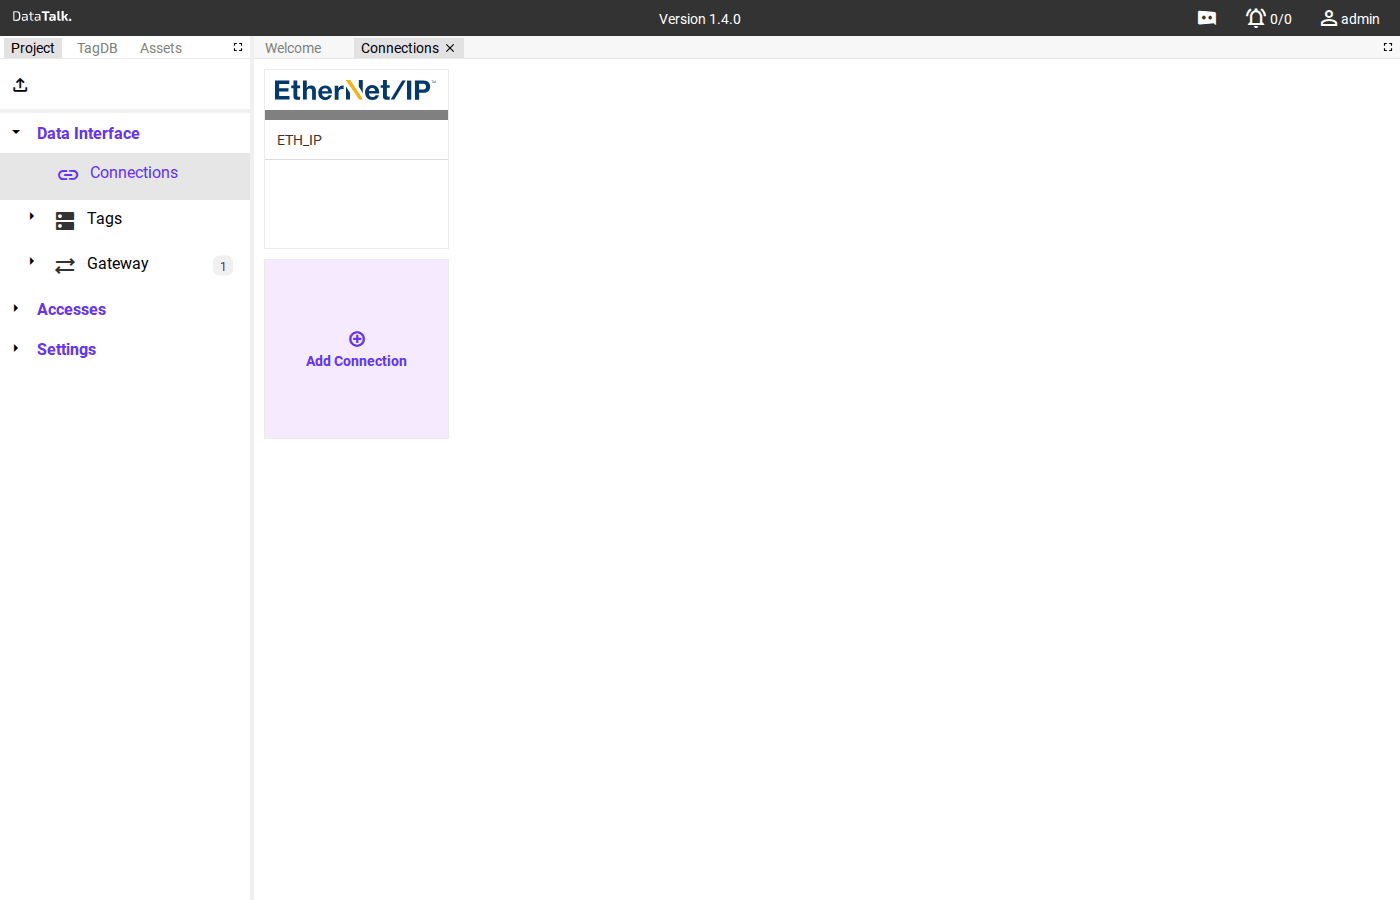
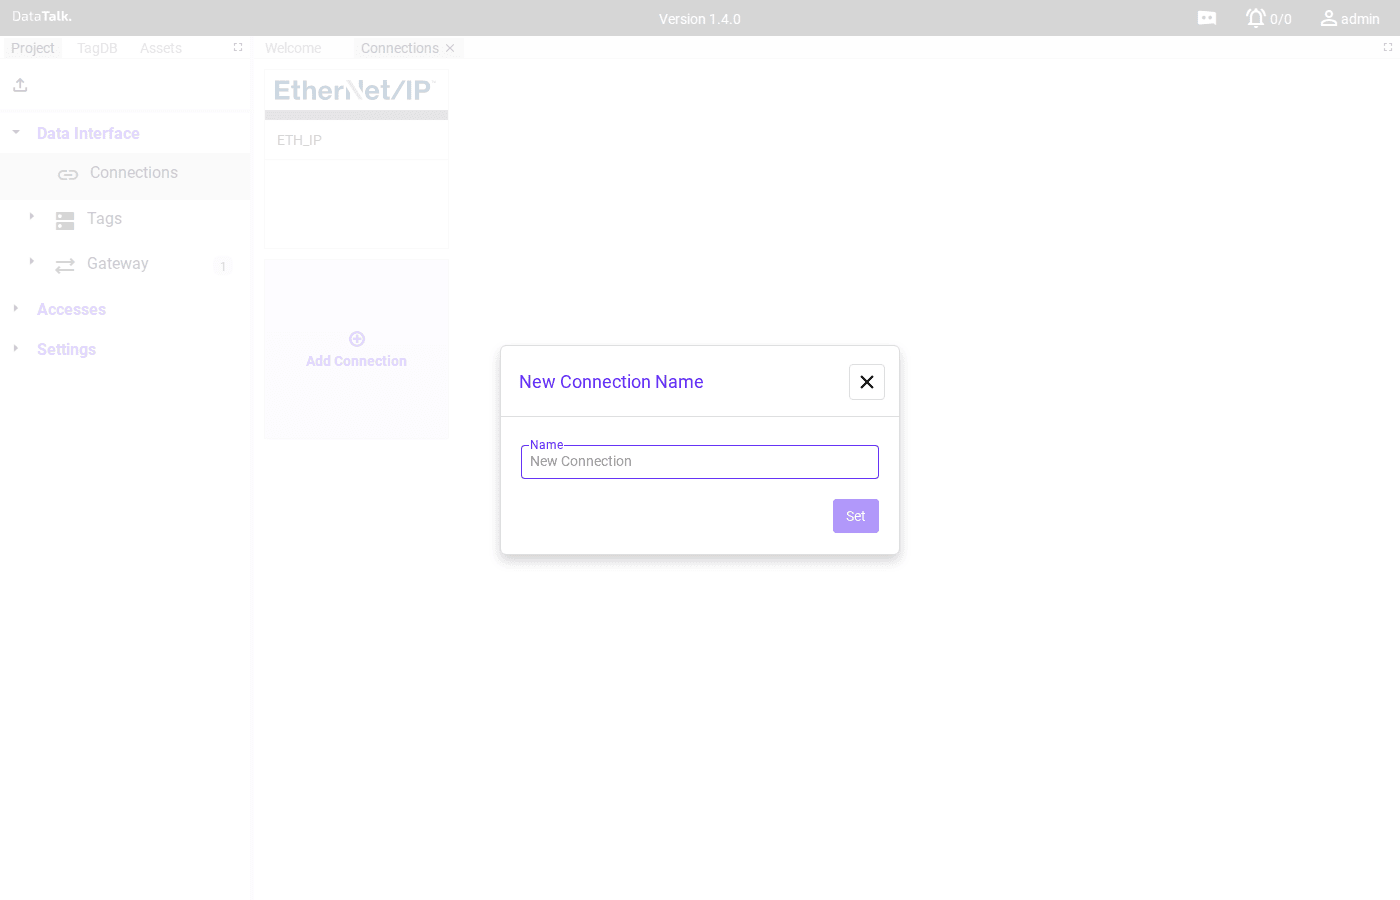
Click the Add Connection tile. A dialog asks for a name — enter a descriptive identifier, e.g. Energy_Meter_Hall_A, and click Set.
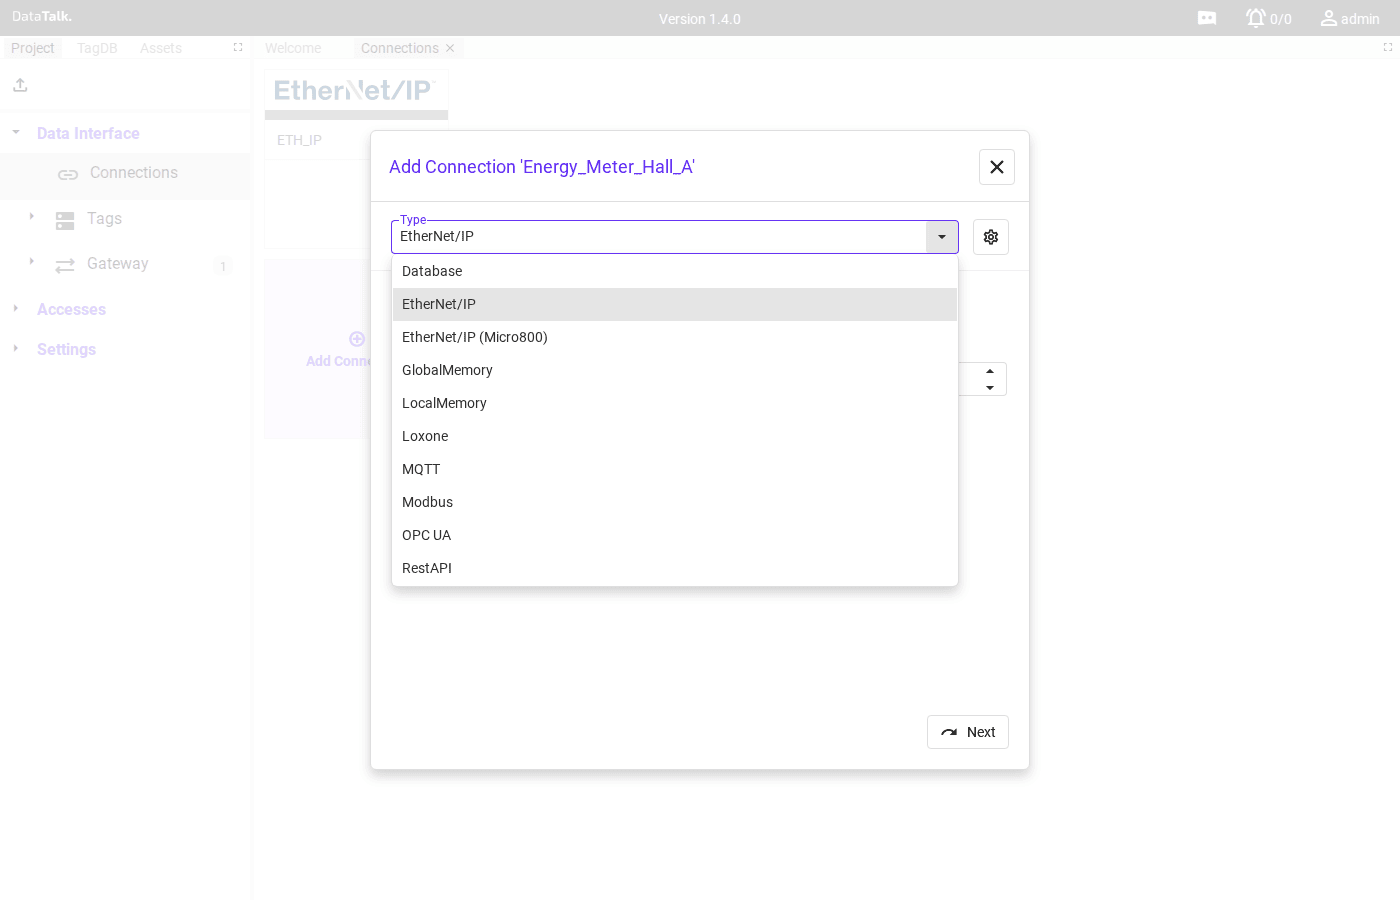
The connection form opens with a Type dropdown. Open it and choose Modbus from the list.
After selecting Modbus, the form shows the connection fields. Enter the details for your device:
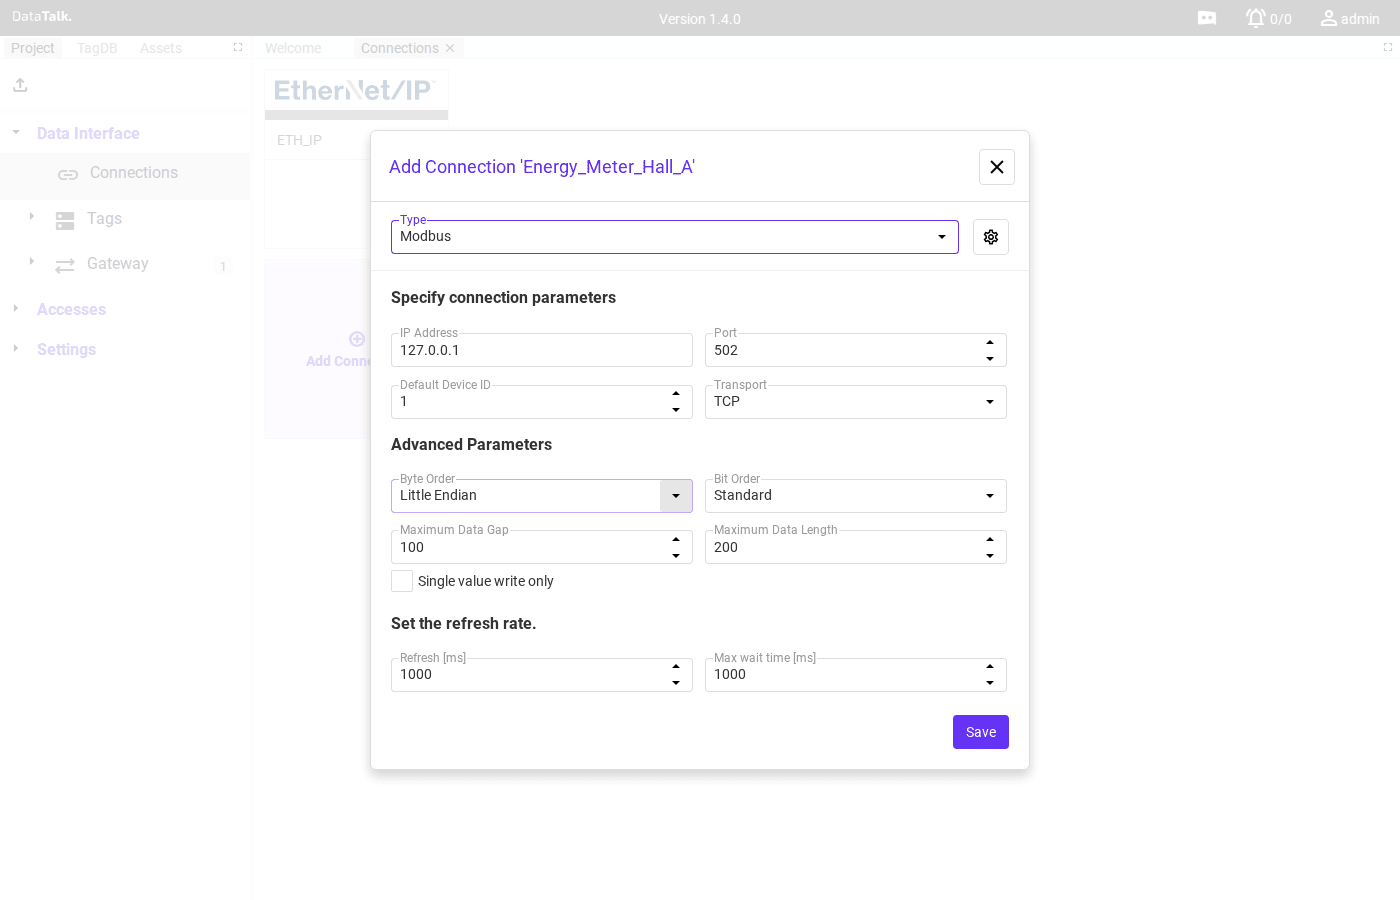
- IP Address — the device’s IP address on your network, e.g.
192.168.1.100 - Port —
502(standard Modbus TCP port) - Default Device ID — the Modbus slave address of the device, typically
1; check your device manual if unsure - Transport —
TCP - Refresh [ms] — how often the gateway reads all tags from this device, e.g.
1000
Click Save. The connection tile appears in the view. A green status indicator means the gateway successfully reached the device. If it stays red, check the IP address, port, and that the device is powered and on the same network.
Step 2 — Add tags and map register addresses
In the left panel, double-click Tag Database under Data Interface → Tags.
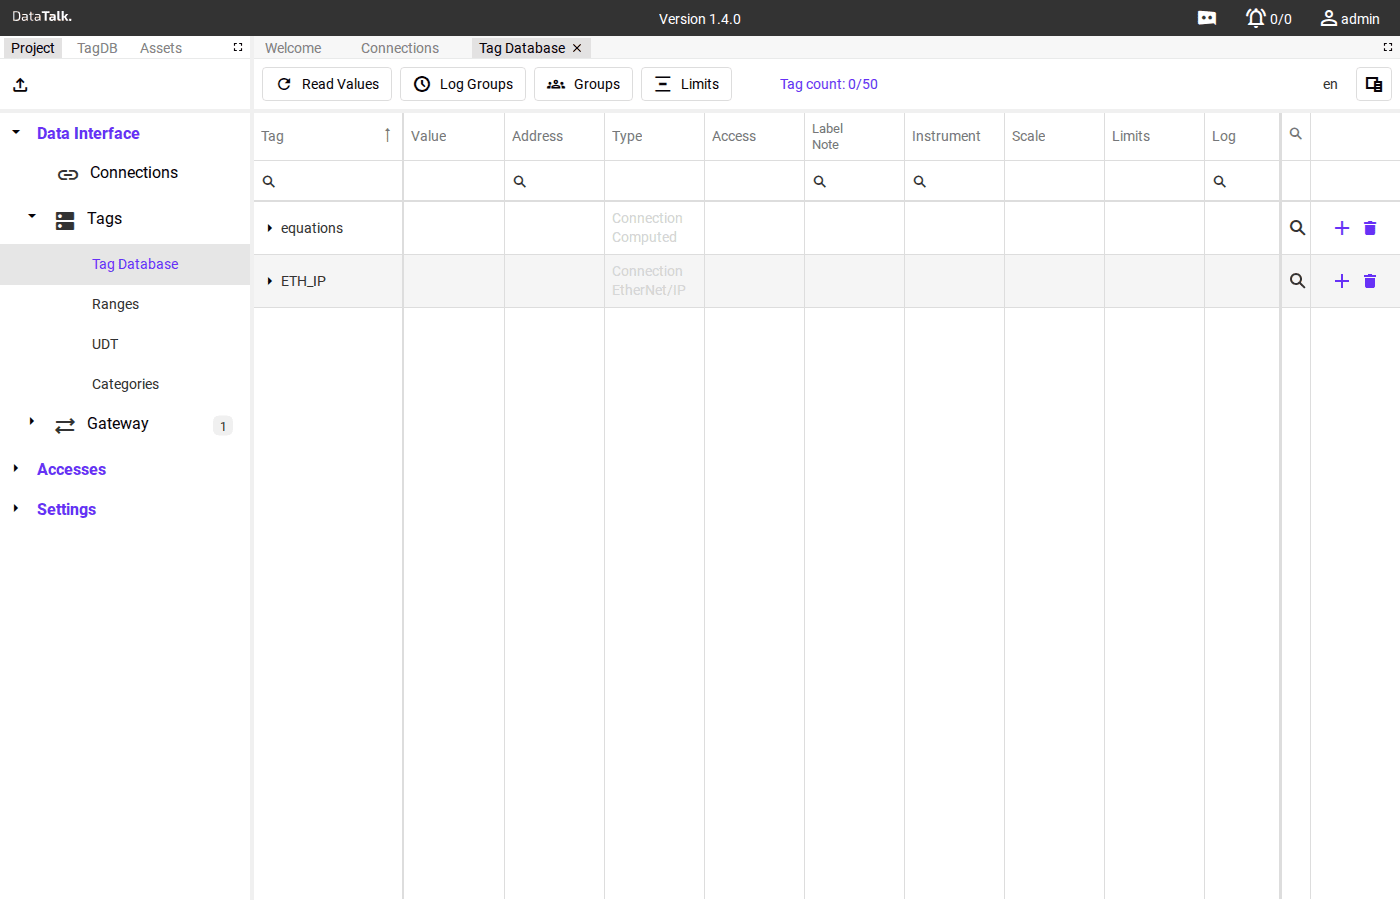
The tag grid shows your connections as expandable rows. Click the ▶ arrow next to Energy_Meter_Hall_A to expand it.
Click the + icon at the end of the Energy_Meter_Hall_A row to add a tag under that connection. A new inline row appears for editing.
Fill in the columns for the first tag:
Tag — Total_Energy_kWh — internal identifier, no spaces; used in formulas and cross-references.
Address — H:0 — holding register 0 in Modbus; check your device register map for the correct number.
Type — FLOAT — must match the data type the device transmits; a wrong type produces garbage values.
Access — R — read-only for sensor inputs; set RW only when operators need to write back to the device.
Label / Note — Total energy consumption — human-readable description shown to operators in HMI views.
Instrument — EM-101 — optional P&ID reference; free-text field for cross-referencing physical documentation.
Scale — 0.1 — use when the device sends an integer scaled by a factor (e.g. raw value 1234 → displayed as 123.4 kWh). Leave at 1 if the device already sends engineering values.
Unit — kWh — engineering unit displayed alongside the value.
Log — default — assigns the tag to the default log group so its history is recorded.
Press Enter or click away to confirm the row.
Repeat for each register you want to read. Common energy meter tags:
Active_Power_W — address H:2, type FLOAT, unit W — instantaneous active power draw.
Voltage_L1_V — address H:10, type UINT16, unit V — phase L1 voltage.
Current_L1_A — address H:12, type FLOAT, unit A — phase L1 current.
Power_Factor — address H:20, type FLOAT, no unit — dimensionless value between 0 and 1.
Frequency_Hz — address H:22, type FLOAT, unit Hz — grid frequency.
Register addresses are specific to your device model. Check the device manual under “Communication registers” or “Modbus map”. Holding registers are written as H:<number> in DataTalk (e.g., holding register 2 → H:2).
Click the Read Values tab at the top of the Tag Database page. Within one polling interval, the Value column should fill in with numbers from the device. If a value shows -- or an error, check the register address and data type against the device manual.
Step 3 — Enable the OPC UA Server
In the left panel, expand Settings and double-click Data Servers.
Click the OPC UA tab at the top of the Data Servers page.
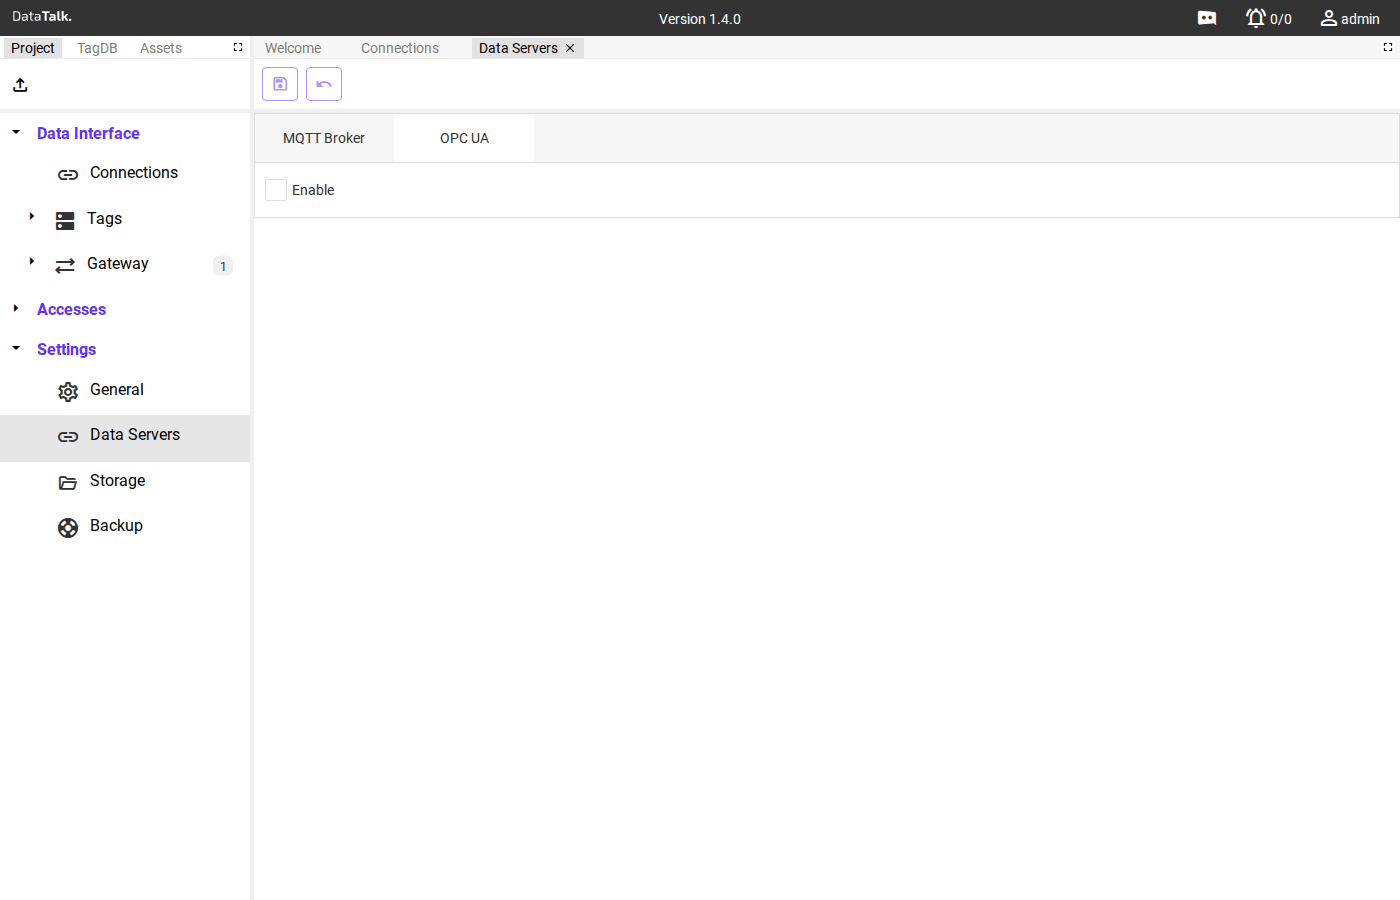
Check the Enable checkbox. The OPC UA Server starts immediately on port 4840 (the standard OPC UA port).
By default, Anonymous access is enabled — any OPC UA client on the network can connect without credentials. For production use, also enable Use User Name and Password and disable Anonymous:
- Check Use User Name and Password — clients must authenticate with a DataTalk user account
- Uncheck Anonymous once you have confirmed clients can connect with credentials
An open OPC UA server exposes your entire tag database — including any writable tags — to anyone on the network who can reach port 4840. Always require authentication before connecting the gateway to a production network or any network accessible from outside the plant.
Click Save. The OPC UA Server is now live.
Step 4 — Connect an OPC UA client and verify
Connect any OPC UA client to the gateway using:
- Endpoint URL:
opc.tcp://<gateway-ip>:4840 - Authentication: Anonymous (or username/password if you enabled it above)
Recommended free clients for testing:
- UaExpert (Unified Automation) — desktop client, browse the full namespace visually
- Prosys OPC UA Browser — lightweight browser with live value display
- opcua-commander — CLI tool for quick verification:
npx opcua-commander -e opc.tcp://192.168.1.10:4840
Once connected, browse the address space. Your tags appear as OPC UA nodes — typically under a folder named after your project or connection. Select any tag node to see its current value, data type, and timestamp updating in real time.
Rather than reading values repeatedly, configure your OPC UA client to subscribe to data change notifications. The gateway pushes an update only when the value changes — eliminating unnecessary polling and reducing network load on both sides.
What you have now
At this point the gateway is:
- Polling the Modbus device every 1 second and caching all register values in the Tag Database
- Recording history for every tag assigned to a log group — accessible for trending and export
- Serving all tag values over OPC UA on port 4840, so any OPC UA client on your network can browse and subscribe without any further configuration
To also push data to the cloud, see the Gateway section — the same tags can be forwarded to AWS IoT Core, Azure IoT Hub, or any external MQTT broker in parallel, with no changes to the Modbus connection or tag definitions.