
Template Design
Design the Word document template — insert placeholders for values, tables, and charts that the report engine fills in at generation time.
On this page
A report template is a standard .docx file designed in Microsoft Word. You control the full layout: fonts, page size, headers, footers, images, colors, and tables. Dynamic content — tag values, timestamps, charts, alarm lists — is inserted as {placeholder} expressions in the text. When the report runs, the engine replaces each expression with real data and delivers the finished document.
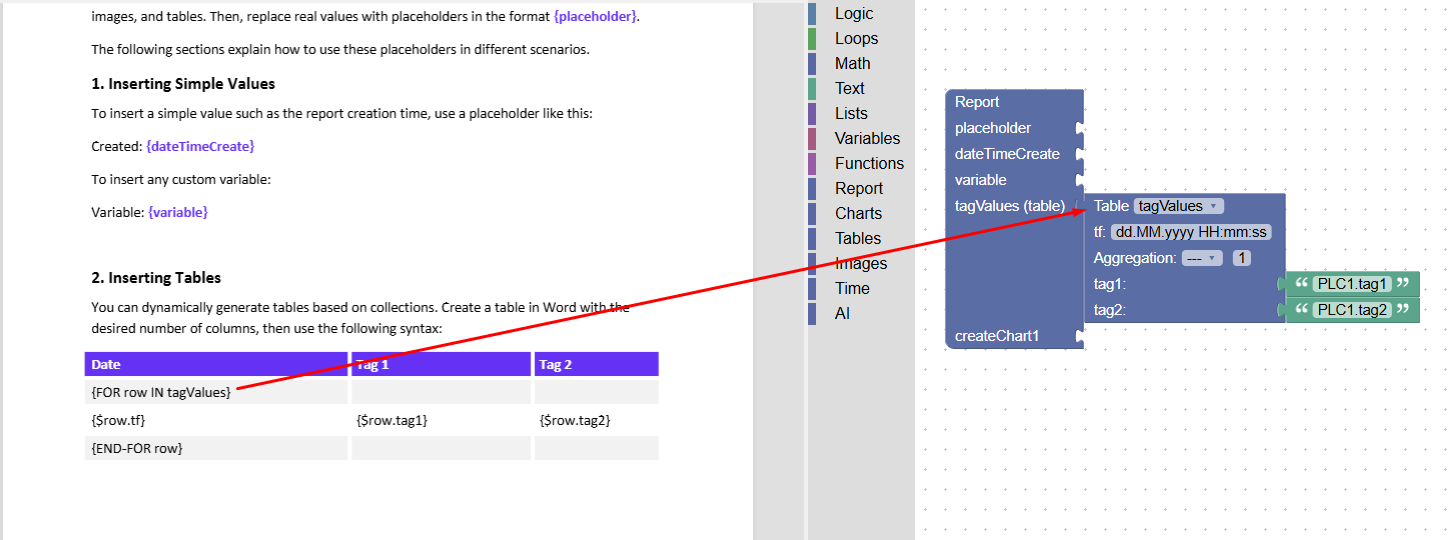
Block editor
The drag-and-drop editor in the Reports section uses puzzle-like blocks to configure how data is fetched and mapped to your Word template placeholders.
Every report starts with a Main Report Block that contains all variables and placeholders detected from the linked .docx template. It serves as the root for all connected blocks in the report logic.
Chart and Tag Blocks attach to the main report block. Connect a chart block to define chart output, then connect tag blocks to it to specify which data series to render. This structured linking prevents invalid configurations and makes dependencies easy to trace.
Block categories
Tables
Table blocks display continuous data over a defined time range. The default table block is named tagValues — this name corresponds directly to the {FOR row IN tagValues} placeholder loop used in the Word template. It accepts historical data from a specified tag over a configured time range and supports the tf time-format field and aggregation type selection.
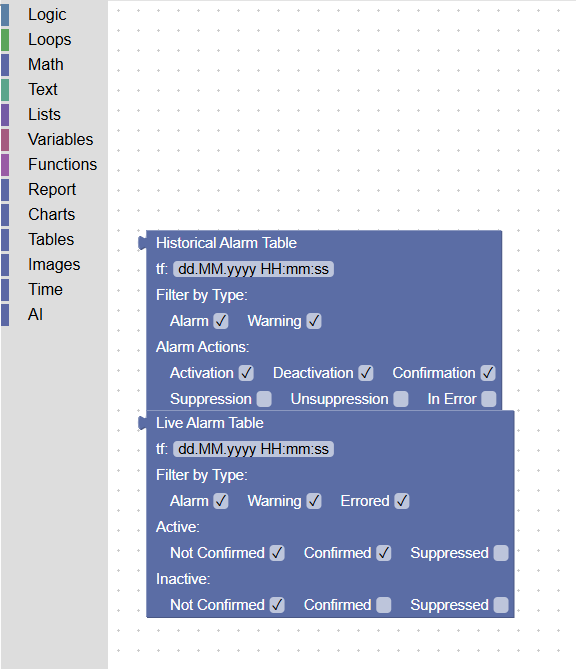
Historical Alarm Table and Live Alarm Table blocks accept historical or live alarm data within a specified time range and feed the alarm loop placeholders in the template.
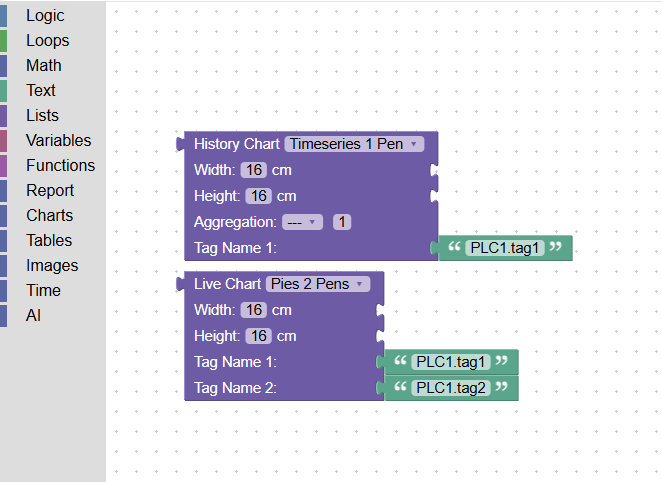
Charts and images
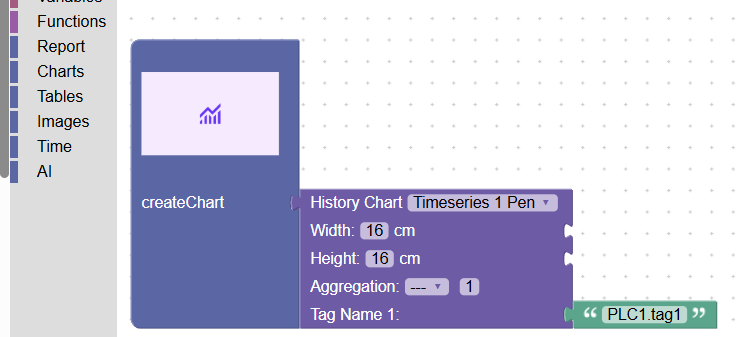
Chart blocks replace {IMAGE chartX()} placeholders in the template. Two variants are available:
Historical Chart — displays historical tag data within a specified time range. Input: Tag Name.
Live Chart — displays the tag value present at the moment the report is generated. Input: Tag Name.
Both chart blocks accept width and height settings and support data aggregation. The chart style (colors, axes, series) comes from the referenced Chart Template.
An Image block can also serve as a placeholder. The key difference is that the placeholder image’s size in the Word template is used to scale the image rendered by the block.
AI block
The AI block feeds its output into any {variable} or {placeholder} in the template. The system sends a configured question to the AI module, and the AI’s text response is inserted into the report at that placeholder position.
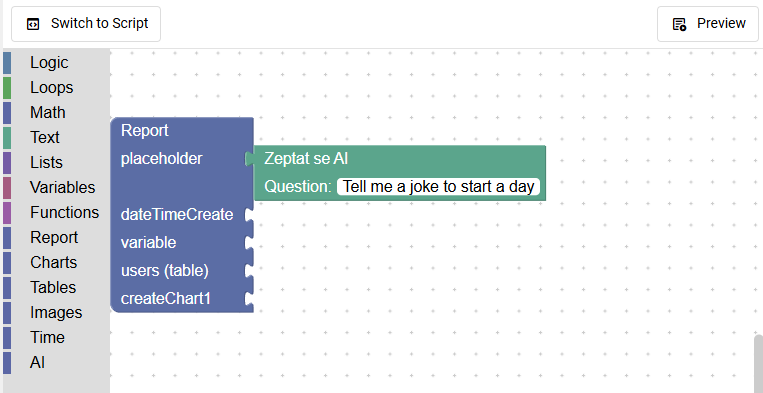
The AI block requires an AI module (such as AI Alarm & Notify) to be configured and active. Purchase of a product that includes the AI module is a prerequisite.
The {placeholder} syntax
Placeholders are plain text in curly braces placed anywhere in the Word document. The engine finds each {expression} and replaces it with the computed value:
Created: {dateTimeCreate}
Operator: {variable}
Motor speed: {motorSpeed}
At generation time this becomes:
Created: 27.07.2026 06:00:00
Operator: John
Motor speed: 1450 rpm
Placeholders are case-sensitive and must exactly match the block name or tag name as defined. The engine leaves unrecognized placeholders unchanged in the output (useful for debugging — anything still shown in curly braces was not resolved).
Inserting simple values
To insert a single value, type {blockName} where the value should appear:
Tag value — type the tag name in curly braces: {tagName}. The current value of that tag (at report generation time) is inserted.
Generation timestamp — {dateTimeCreate} inserts the exact date and time the report was produced.
Custom variable — {variable} inserts the value of a variable defined in the Variables block category.
Inserting a data table
To generate a multi-row table of historical tag values, use the loop syntax inside a Word table. Create a table in Word with the desired column headers, then use these expressions in the data rows:
| Date                      | Tag 1          | Tag 2          |
|---------------------------|----------------|----------------|
| {FOR row IN tagValues}    |                |                |
| {$row.tf}                 | {$row.tag1}    | {$row.tag2}    |
| {END-FOR row}             |                |                |
The engine expands the middle row (the loop body) into one row per data point from the Tag Database query. The column count is flexible — add as many {$row.tagN} columns as needed.
{FOR row IN tagValues} — begins the loop. The name after IN identifies the data source (configured in the Table block in the Function Reference). The name before IN (row) is the row variable used in expressions.
{$row.tf} — the timestamp for this row, formatted according to the tf format string configured in the Table block.
{$row.tag1}, {$row.tag2}, … — tag values for this row. The tag names (tag1, tag2) must match the tag identifiers configured in the Table block.
{END-FOR row} — ends the loop.
Inserting a chart
To insert a chart image into the document, place a History Chart block expression at the desired position. The chart is rendered as an image embedded in the PDF at that location:
{History Chart | Width: 16 cm | Height: 12 cm | Tag: temperature}The chart style (type, colors, axes, line widths) comes from the Chart Template referenced in the History Chart block. The data (which tag, which time range) is configured in the block itself.
Inserting the current time or date
Use expressions from the Time category anywhere in the document:
Report generated: {Date+Time}
Time only: {Time}
Date only: {Date}
Format strings are configured in the block editor — for example dd.MM.yyyy HH:mm:ss for European date-time format.
Inserting an alarm table
To generate an alarm event list, use the Historical Alarm Table or Live Alarm Table block. The loop syntax is the same as for tag value tables. Configure alarm filters (type, action types) in the block parameters.
Complete example — daily production report
1 — Design the Word document
Open Microsoft Word, set up page layout, headers, and footers. Insert the following content:
DataTalk Production Report
Generated: {dateTimeCreate}

== Shift Summary ==

| Timestamp            | Temperature   | Pressure      |
|----------------------|---------------|---------------|
| {FOR row IN tagValues} |              |               |
| {$row.tf}            | {$row.tag1}   | {$row.tag2}   |
| {END-FOR row}        |               |               |

[chart placeholder for temperature trend]

== Active Alarms at Time of Report ==

| Time                 | Tag           | Description   |
|----------------------|---------------|---------------|
| {FOR row IN alarms}  |               |               |
| {$row.tf}            | {$row.tag}    | {$row.desc}   |
| {END-FOR row}        |               |               |
2 — Import the template
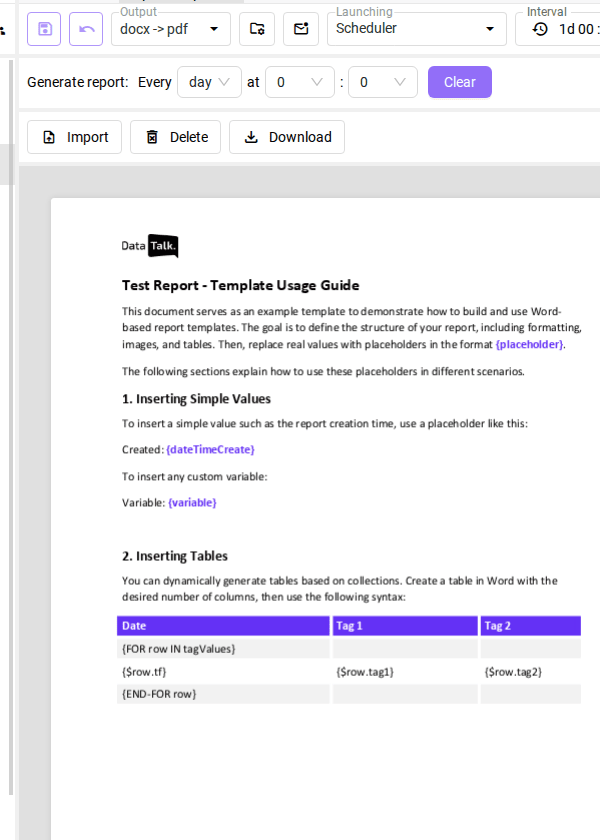
In the Reports editor, click Import and select the .docx file. The document preview shows the placeholder expressions highlighted in purple.
3 — Configure the function blocks
In the function browser on the right, select the Tables → Table block and configure:
- Data source:
tagValues tfformat:dd.MM.yyyy HH:mm:sstag1:temperature,tag2:pressure
Select Charts → History Chart and configure:
- Width: 16 cm, Height: 10 cm
- Tag Name 1:
temperature - Chart Template: Time-series 1 Pen
4 — Set the schedule
Output: docx → pdf | Launching: Scheduler | Interval: 1d 00:00 | Every day at 6 : 0
5 — Save and verify with Preview
Click Save, then Preview to see the rendered output with today’s data. Verify timestamps, table row count, and chart appearance.
Complete all layout work in Microsoft Word first — fonts, margins, page orientation, header/footer, table styling. Then add {placeholder} expressions as plain text at the end. This separates layout decisions from data binding and makes both steps easier to iterate on independently.
After importing a template, use Download to retrieve the current .docx, make changes in Word, and re-import. This round-trip lets you refine the template design and placeholder positions without losing the block configuration.
Script editor
The Script Editor is an advanced alternative to the drag-and-drop block editor, intended for users who prefer a code-based workflow with full control over report logic.
The editor includes a library of predefined functions for common report operations, reducing the need to write low-level logic from scratch. Chart Templates can be inserted directly into the script — selecting a template automatically generates the corresponding chart code, which you can then adjust or embed in your report logic.
Script mode is suited for complex conditional sections, dynamic chart selection, and custom calculations that are difficult to express with blocks.
Once a report is switched from the drag-and-drop block editor to Script mode, it cannot be reverted. The change is permanent for that report. Use Script mode only when the block editor genuinely cannot meet the requirement.