
Quick start: first report from a live device
Step-by-step guide — connect a Modbus TCP device, log its values as named tags, build a Word template with placeholder expressions, and schedule a daily PDF report.
On this page
This guide walks through a complete end-to-end setup: reading data from a Modbus TCP device, logging values into the Tag Database, and producing a scheduled PDF report from a Word document template — all without writing a single line of code.
By the end you will have:
- A Modbus TCP connection polling a field device on your network
- Named tags with logging enabled, feeding live and historical values
- A Word
.docxtemplate with{placeholder}expressions for values, timestamps, and a data table - A daily scheduled report that generates automatically and appears in the Files view as a downloadable PDF
Time required: 20–30 minutes.
Step 1 — Add a Modbus TCP connection
Switch to Edit Mode by clicking the pencil icon in the top-right corner. In the left panel, double-click Connections under Data Interface. The tile view opens.
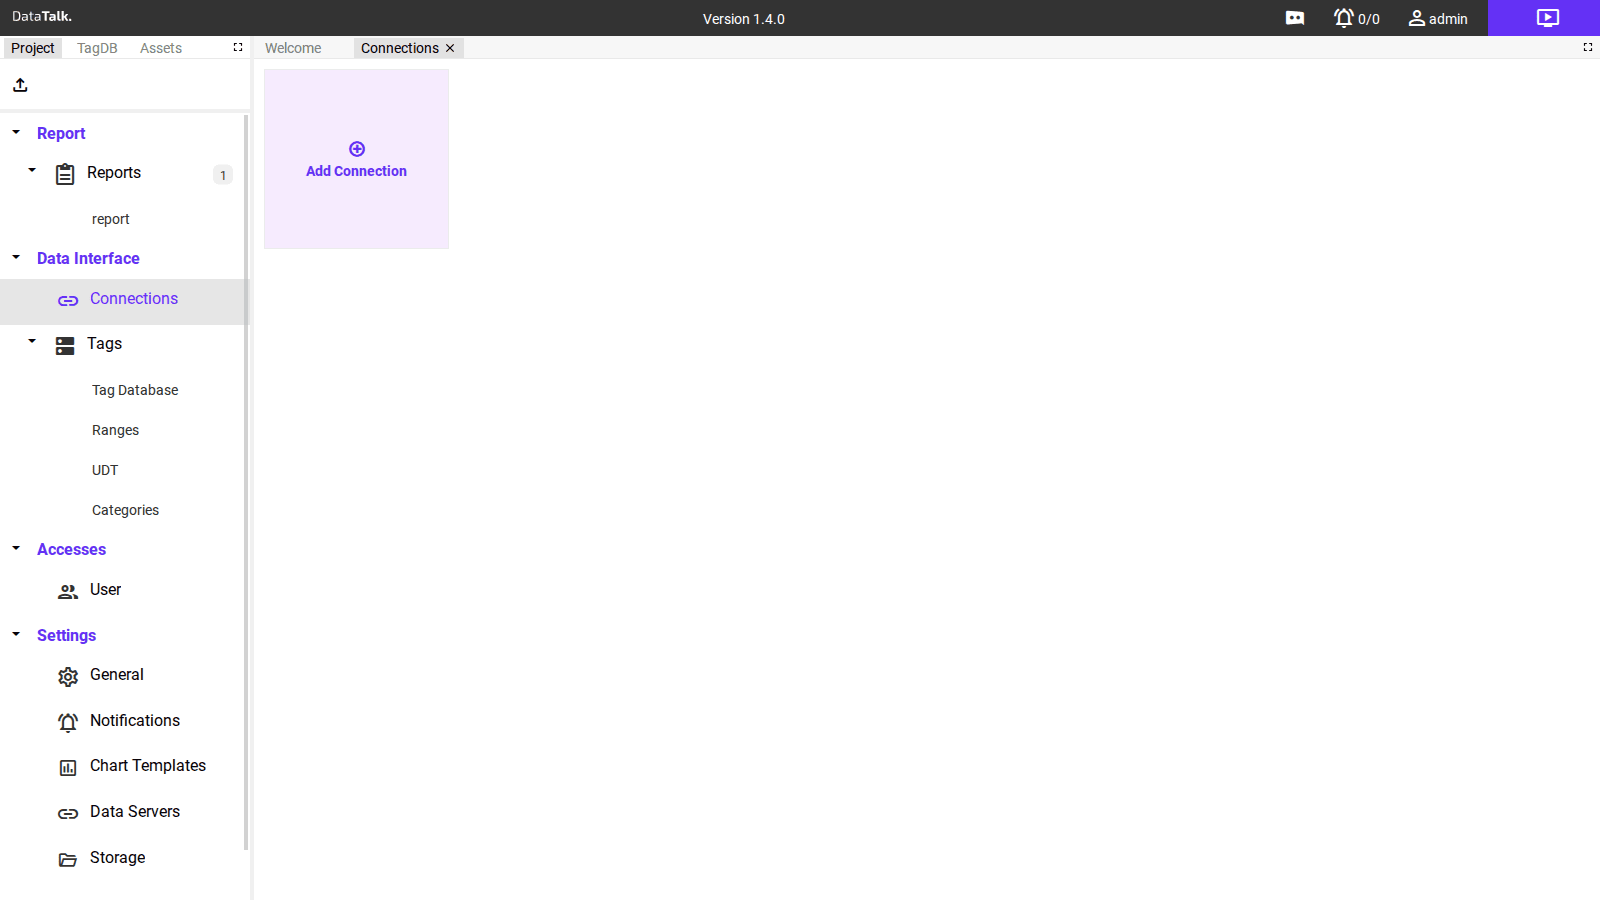
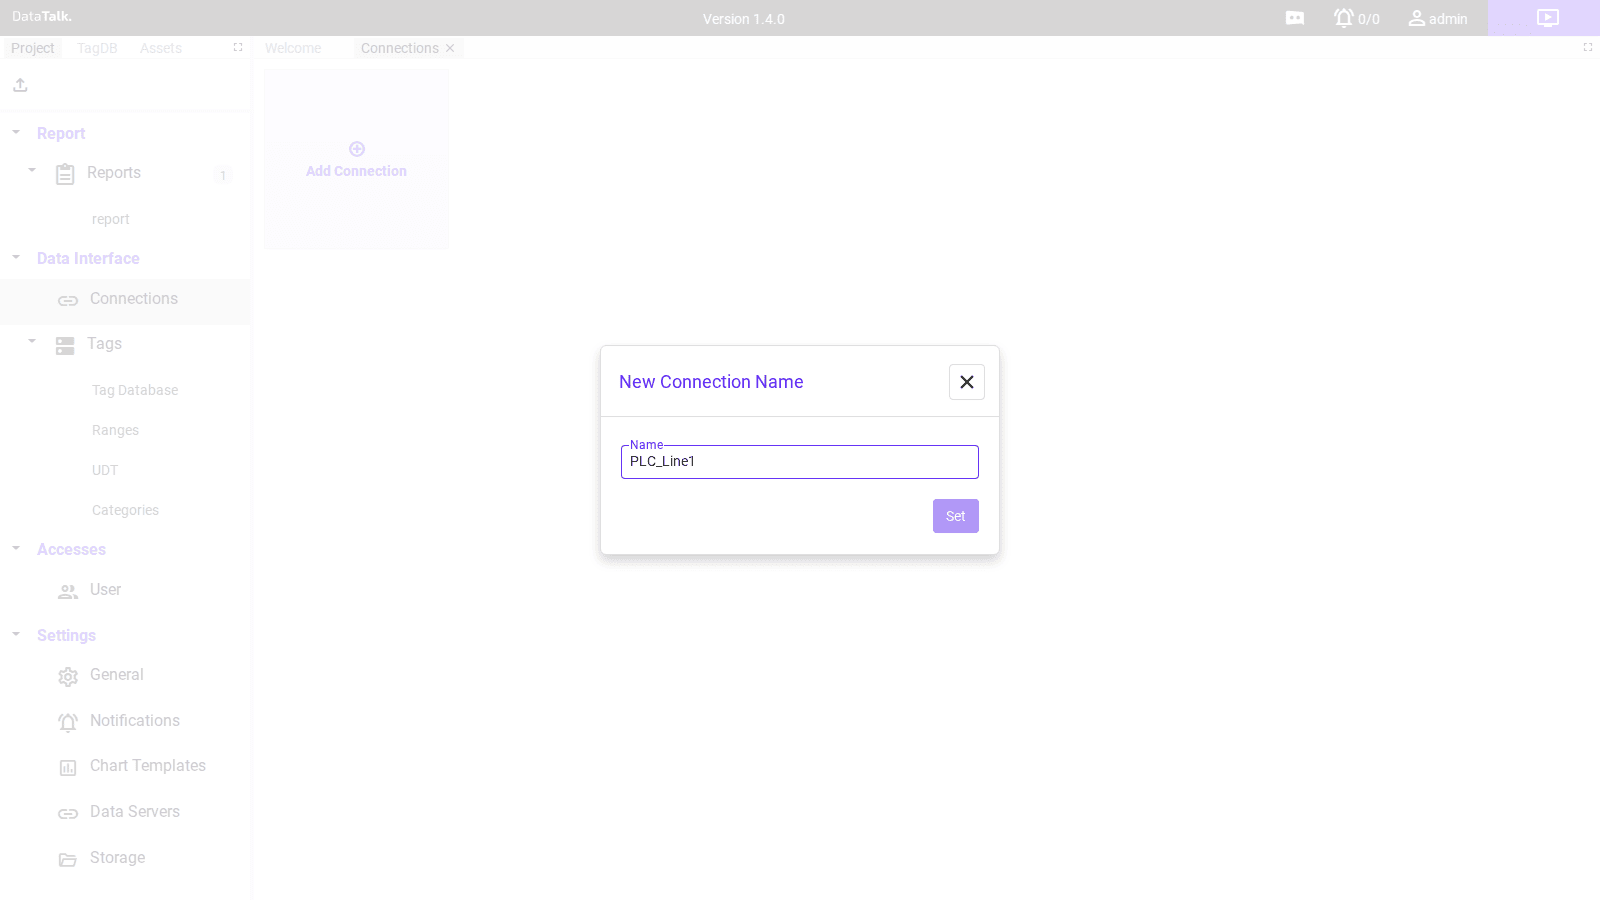
Click the Add Connection tile. A dialog appears asking for a name. Enter a short identifier with no spaces — something that identifies the physical device, e.g. PLC_Line1 — and click Set.
The connection form opens. Open the Type dropdown and choose Modbus TCP.
Other available protocols include Modbus UDP, OPC UA Client, EtherNet/IP (Allen-Bradley), Siemens OPC UA, MQTT Client, REST API, and SQL. This guide uses Modbus TCP as the most common starting point for field devices.
After selecting Modbus TCP, the form shows the connection fields:
IP Address — the device’s IP address on your network, e.g. 192.168.1.100.
Port — 502 (the standard Modbus TCP port; change only if your device uses a non-standard port).
Default Device ID — the Modbus slave address, typically 1; check your device manual if you are unsure.
Refresh [ms] — how often the application polls all tags from this connection, e.g. 1000 for once per second.
Create one connection per physical device or data source. If you have three PLCs, create three connections. All tags from a device are grouped under their connection in the Tag Database.
Click Save. The connection tile appears in the view. A green status badge means the application reached the device. If it shows red, check the IP address, port, and that the device is reachable on the same network.
Step 2 — Add tags to the Tag Database
In the left panel, double-click Tag Database under Data Interface → Tags.
The grid shows all connections as expandable rows. Each connection row has a + button on the right to add tags under it.
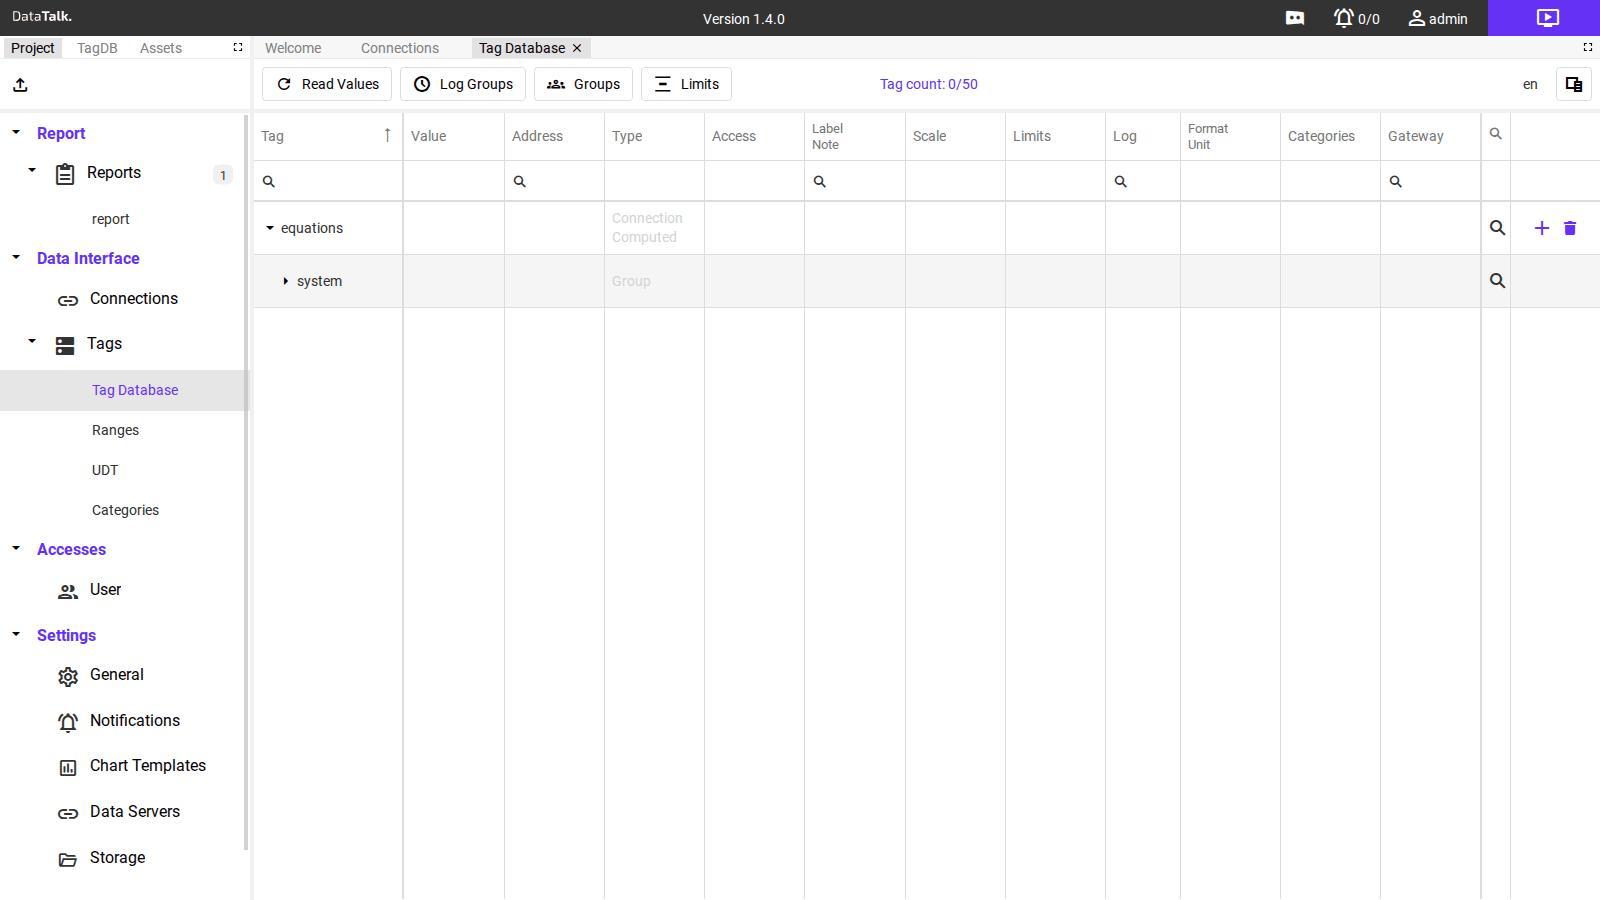
Hover over the PLC_Line1 row and click the + button at the right end. A new inline row appears for editing. Fill in the columns:
Tag — TotalEnergy_kWh — internal identifier used in report placeholders and formulas. No spaces; use underscores.
Address — H:0 — holding register 0. Check your device’s register map for the correct number. Holding registers use the H: prefix; input registers use I:.
Type — FLOAT — must match the data type the device transmits. A wrong type produces garbage values.
Access — R — read-only for sensor inputs. Use RW only when you need to write back to the device.
Label / Note — Total energy consumption — human-readable description shown in alarm and report contexts.
Scale — 0.1 — use when the device sends a scaled integer (e.g. raw 1234 → displayed 123.4 kWh). Leave at 1 if the device already sends engineering-unit values.
Format / Unit — kWh — engineering unit appended when displaying the value.
Log — default — assigns the tag to the default log group so its history is recorded. Tags without a log group are read live but not stored historically.
Press Enter or click elsewhere to confirm the row.
Repeat for each register you want to include in the report. Common energy meter example tags:
ActivePower_W — address H:2, type FLOAT, unit W — instantaneous active power draw.
Voltage_L1_V — address H:10, type UINT16, unit V — phase L1 voltage.
Current_L1_A — address H:12, type FLOAT, unit A — phase L1 current.
Frequency_Hz — address H:22, type FLOAT, unit Hz — grid frequency.
Register addresses are specific to your device model. Look in the device manual under “Communication registers” or “Modbus map”. In DataTalk, holding register 2 is written as H:2, input register 5 as I:5.
Click the Read Values tab at the top of the Tag Database page. Within one polling interval, the Value column fills in with live numbers from the device. If a value shows -- or an error, check the register address and data type in the device manual.
Step 3 — Build the Word template
The report template is a standard .docx file you create in Microsoft Word. Wherever you want a dynamic value, insert the corresponding {placeholder} as plain text.
The app ships with a ready-made template called Test Report - Template Usage Guide that demonstrates every placeholder type, including tables, charts, and simple values. In the report editor, click Download in the toolbar to save this template as a .docx file and use it as your starting point instead of building from scratch.
Open Microsoft Word and create a new document (or open the downloaded default template). Design the report layout — add your company logo, report title, and any static text such as section headings.
Wherever you want the report generation timestamp or a tag value, type the placeholder name in curly braces as plain text:
Report generated: {dateTimeCreate}

Total energy this period: {tagValues.TotalEnergy_kWh}

Active power at report time: {tagValues.ActivePower_W}
The placeholder names are set in the report editor. {dateTimeCreate} is always the generation time. For tag values, use the Report or tagValues block in the editor to configure what each placeholder returns (latest value, average, min, max, sum, etc.).
To include a table of historical readings, create a Word table with the desired number of columns. The loop that repeats rows uses three special markers — placed in separate rows of the same Word table:
Row 1 — loop start: {FOR row IN tagValues} (can be in any cell of that row; the other cells remain empty)
Row 2 — data row: one placeholder per column, e.g. {$row.tf} for the timestamp, {$row.tag1} and {$row.tag2} for tag values. This is the row the engine repeats for every logged data point.
Row 3 — loop end: {END-FOR row} (same pattern as the start row)
At generation time the engine removes the start and end rows and repeats the data row once per logged reading, substituting the actual timestamp and tag values.
Save the document as a .docx file, e.g. daily-energy-report.docx. Keep it accessible for the next step.
Step 4 — Import the template and schedule the report
In the left panel, double-click the report item under Report → Reports. The report editor opens, showing the Word template preview on the left and the function block palette on the right.
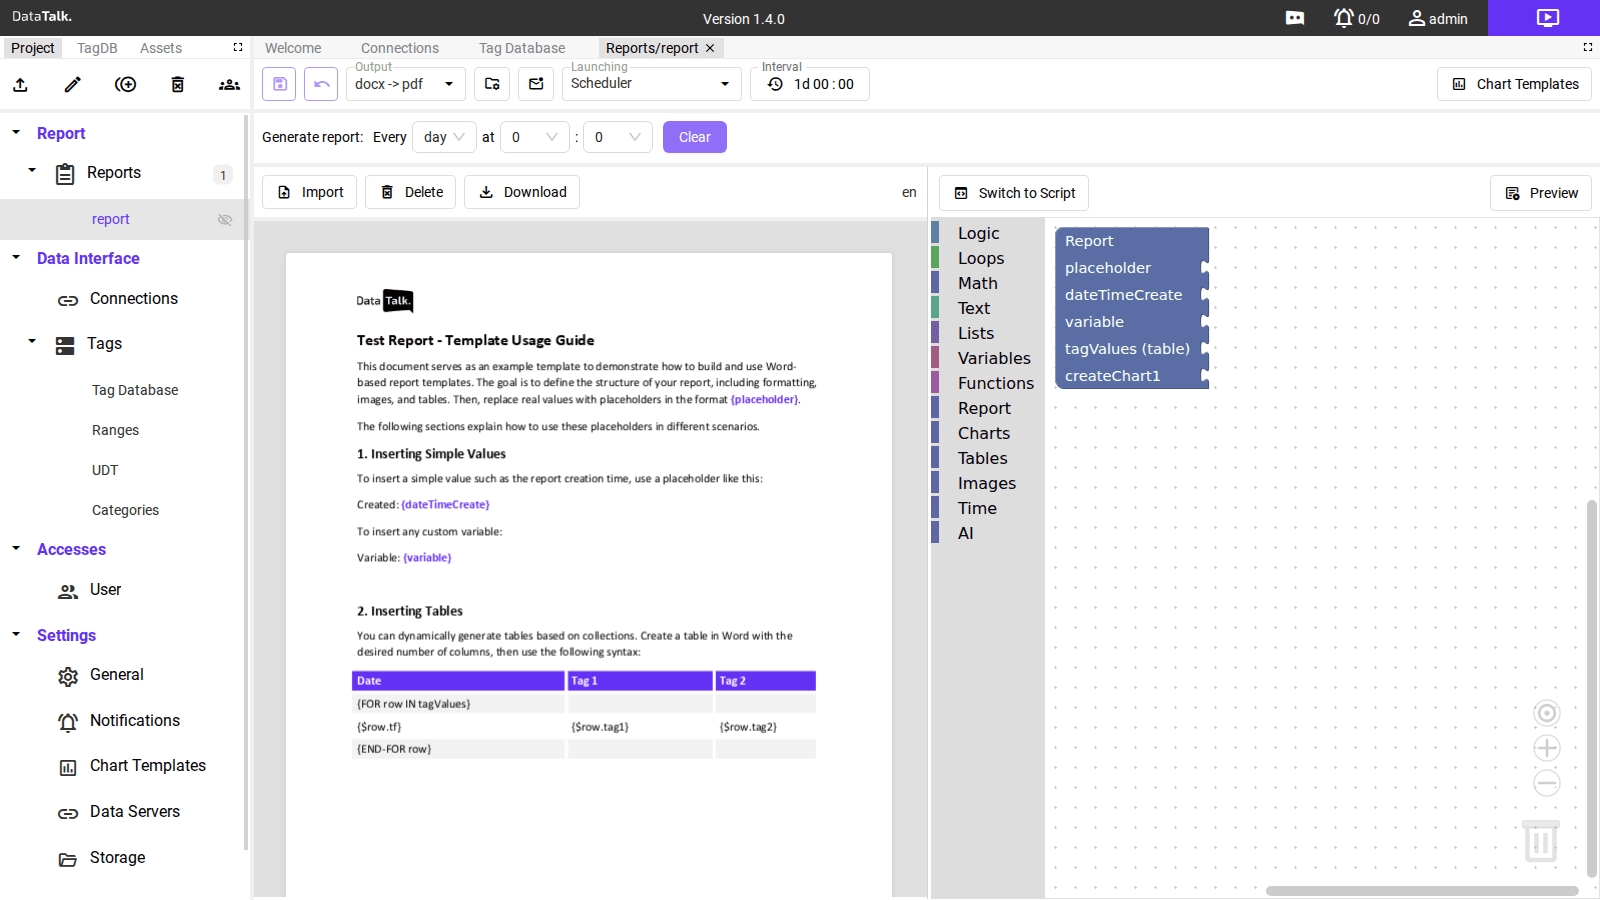
Click Import in the toolbar. Select your daily-energy-report.docx file. The editor loads the template and displays it in the preview pane. Placeholder expressions are highlighted in purple so you can verify they were recognized.
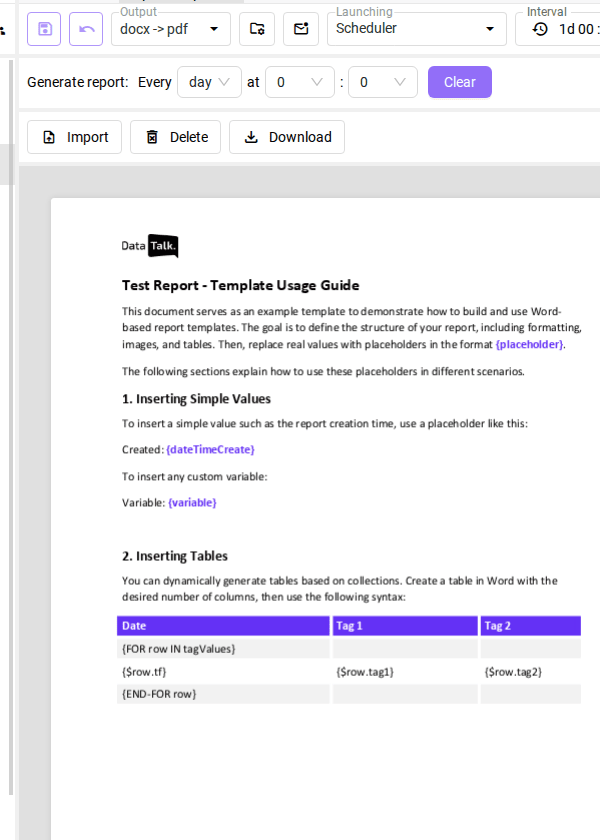
In the top toolbar, set Output to docx → pdf. This converts the filled Word document to a PDF at generation time.
Set Launching to Scheduler and configure the interval:
Every day at 06:00 — generates a daily report at 6 AM covering the previous day’s data.
The Interval field (format 1d 00:00) sets the time window of historical data to include: 1d 00:00 covers the last 24 hours, 7d 00:00 covers the last 7 days.
Use Preview in the top right to generate the report immediately using the current data window. This lets you verify that all placeholders resolve correctly before enabling the schedule.
For each {placeholder} in your template, drag the corresponding block from the function palette into the editor. For a tagValues table, use the Tables → tagValues block and configure:
tf — the time frame; set to report to match the report’s configured interval.
Aggregation — raw for individual readings, avg / min / max / sum for aggregated values.
Tag columns — add one column per tag, select the tag from the Tag Database, and set the column name.
Click Save (or press the save icon in the toolbar). The report is now scheduled and will generate automatically.
What a generated report looks like
When the scheduler runs (or when you click Preview in the editor), the engine fills every {placeholder} with real values and converts the result to PDF. The output is a standard document — company header, narrative text with live numbers, and a data table that expands to as many rows as there are logged readings for the time window:
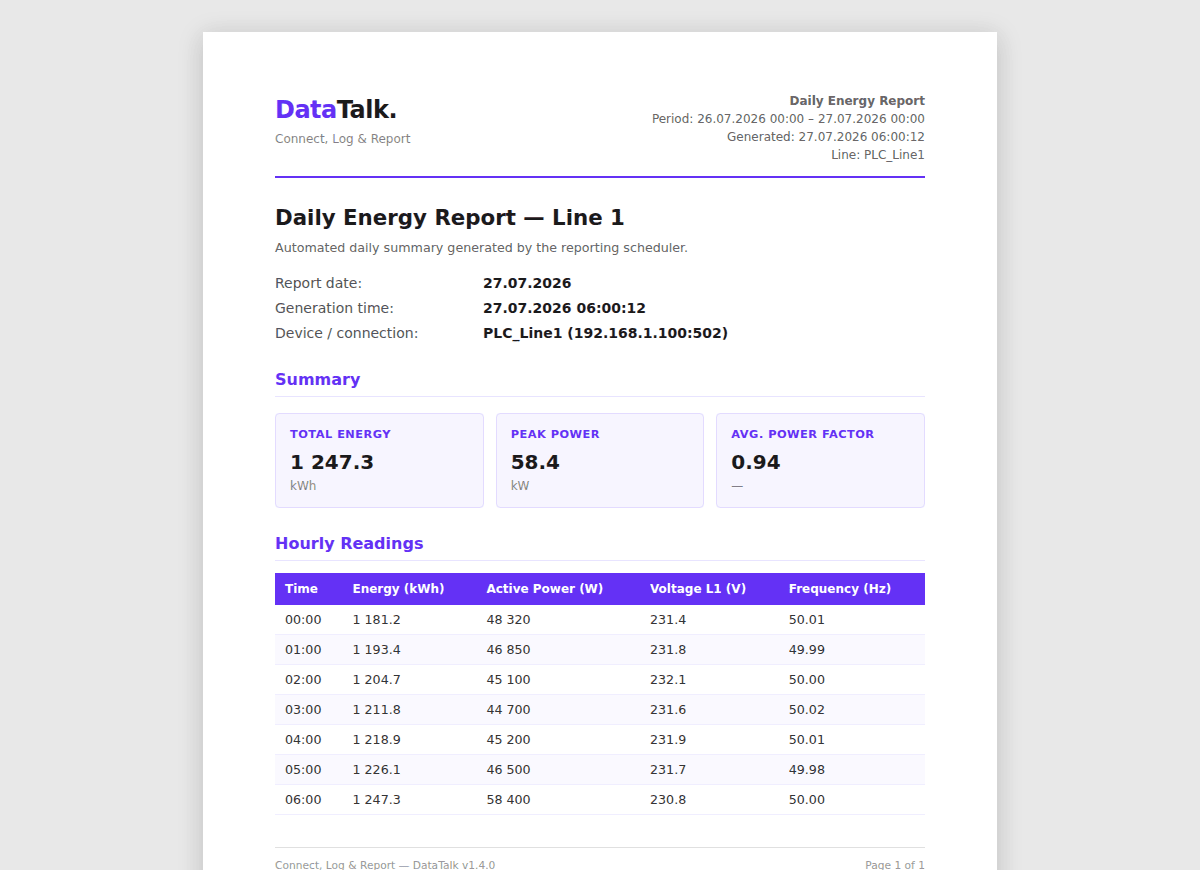
Every column in the data table maps to one tag you configured in Step 2. The number of rows depends on the log interval and the report time window — a one-hour interval over a 24-hour window produces 24 rows.
Step 5 — Access the generated report
After the first scheduled generation time passes, switch to View Mode by clicking the view icon in the top-right corner. The Files section shows all generated report files. Click any file to download it.
Reports are also accessible in Edit Mode — click Download in the report editor toolbar to download the most recently generated version.
Configure report delivery to email or a network folder in Notifications so recipients receive each report without needing to log in. Email delivery runs immediately after each generation and attaches the PDF.
What you have now
At this point the application is:
- Polling the Modbus device on the configured interval and storing all tagged values in the historical database
- Generating a PDF report every day at 06:00, automatically replacing each
{placeholder}with real values from the tag history - Archiving all generated reports in the built-in file manager, accessible to anyone with View Mode access
To extend the report with charts, add a History Chart block from the Charts category in the function palette and reference a Chart Template you have defined. For alarm summaries, add a Historical Alarm Table block from the Tables category.
See the Function Reference for the complete block catalogue.