
Function Reference
Complete reference for all block categories in the report function browser — Report, Charts, Tables, Time, Logic, and more.
On this page
The function browser on the right side of the report editor is a categorized library of blocks. Each block corresponds to a {placeholder} expression that can be inserted into the Word template. Click a category name to view its blocks; click a block to insert it at the cursor position in the template.
Blocks are color-coded by category so they are easy to identify in the document preview.
Report
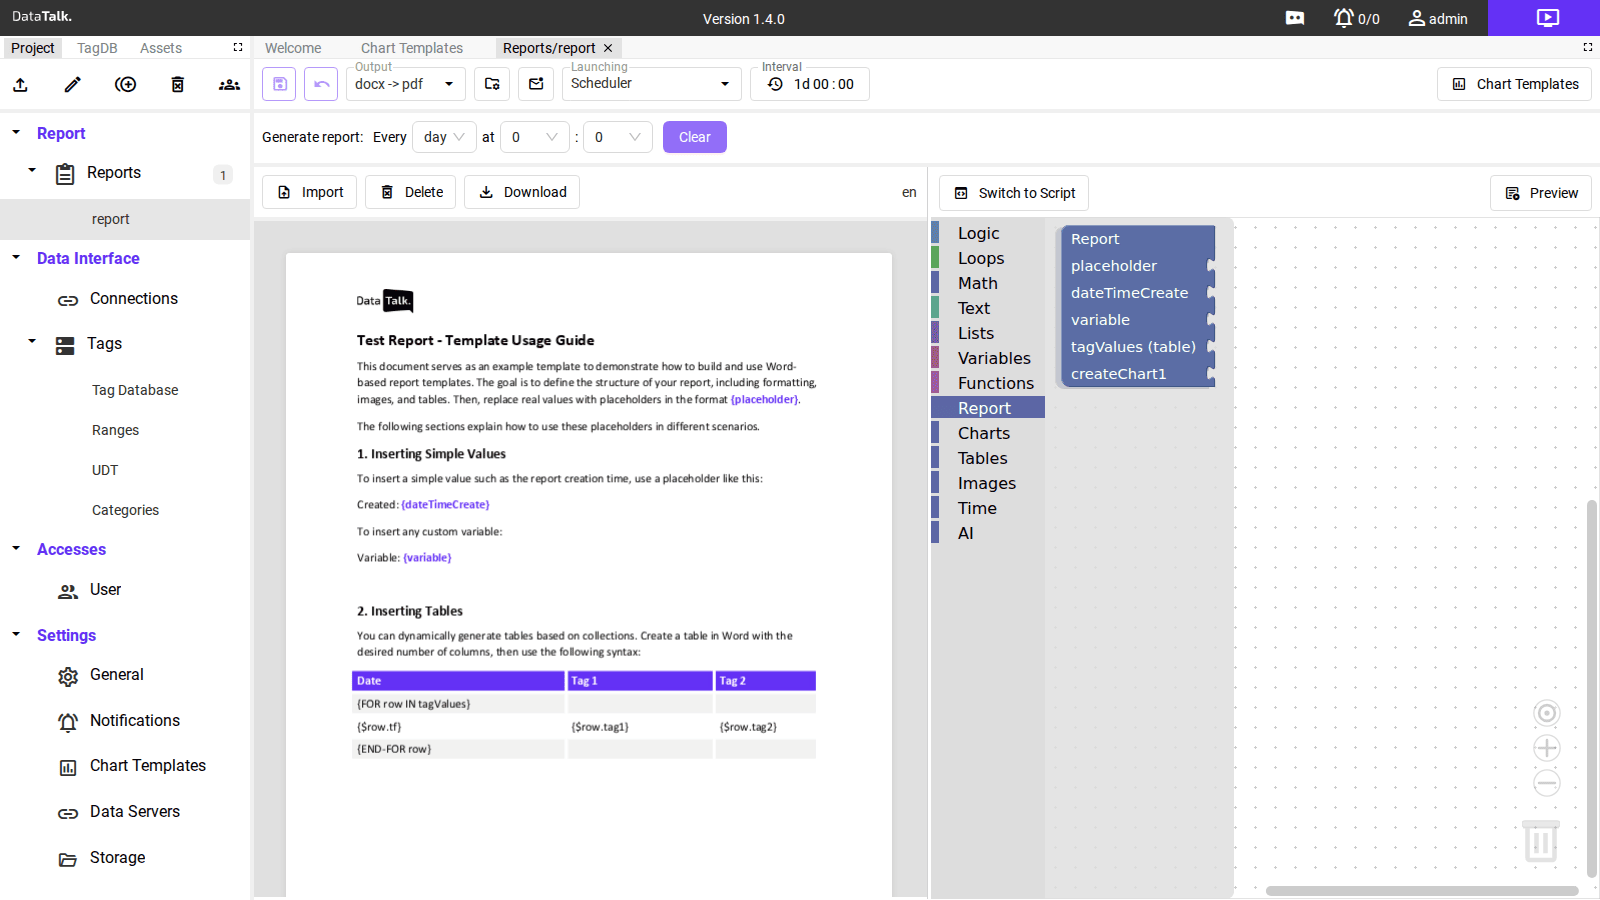
The Report category contains the fundamental building blocks used in nearly every report.
{placeholder} — a generic single-value substitution. Replace placeholder with the name of any tag or configured variable to insert its current value. Example: {pumpPressure} inserts the value of the tag named pumpPressure.
{dateTimeCreate} — inserts the exact date and time at which the report was generated. Used in report headers and footers to timestamp the document.
{variable} — inserts the value of a user-defined variable. Define the variable name and its expression in the Variables category first, then reference it with {variableName} anywhere in the document.
{tagValues (table)} — the starting point for a multi-row data table. Configure the data source, timestamp format, and tag columns in the block, then use the {FOR row IN tagValues}...{END-FOR row} loop syntax in the Word table (see Template Design).
{createChart1} — inserts a chart rendered from the first Chart Template defined in the project. For charts referenced by name or with custom parameters, use the Charts category blocks.
Charts
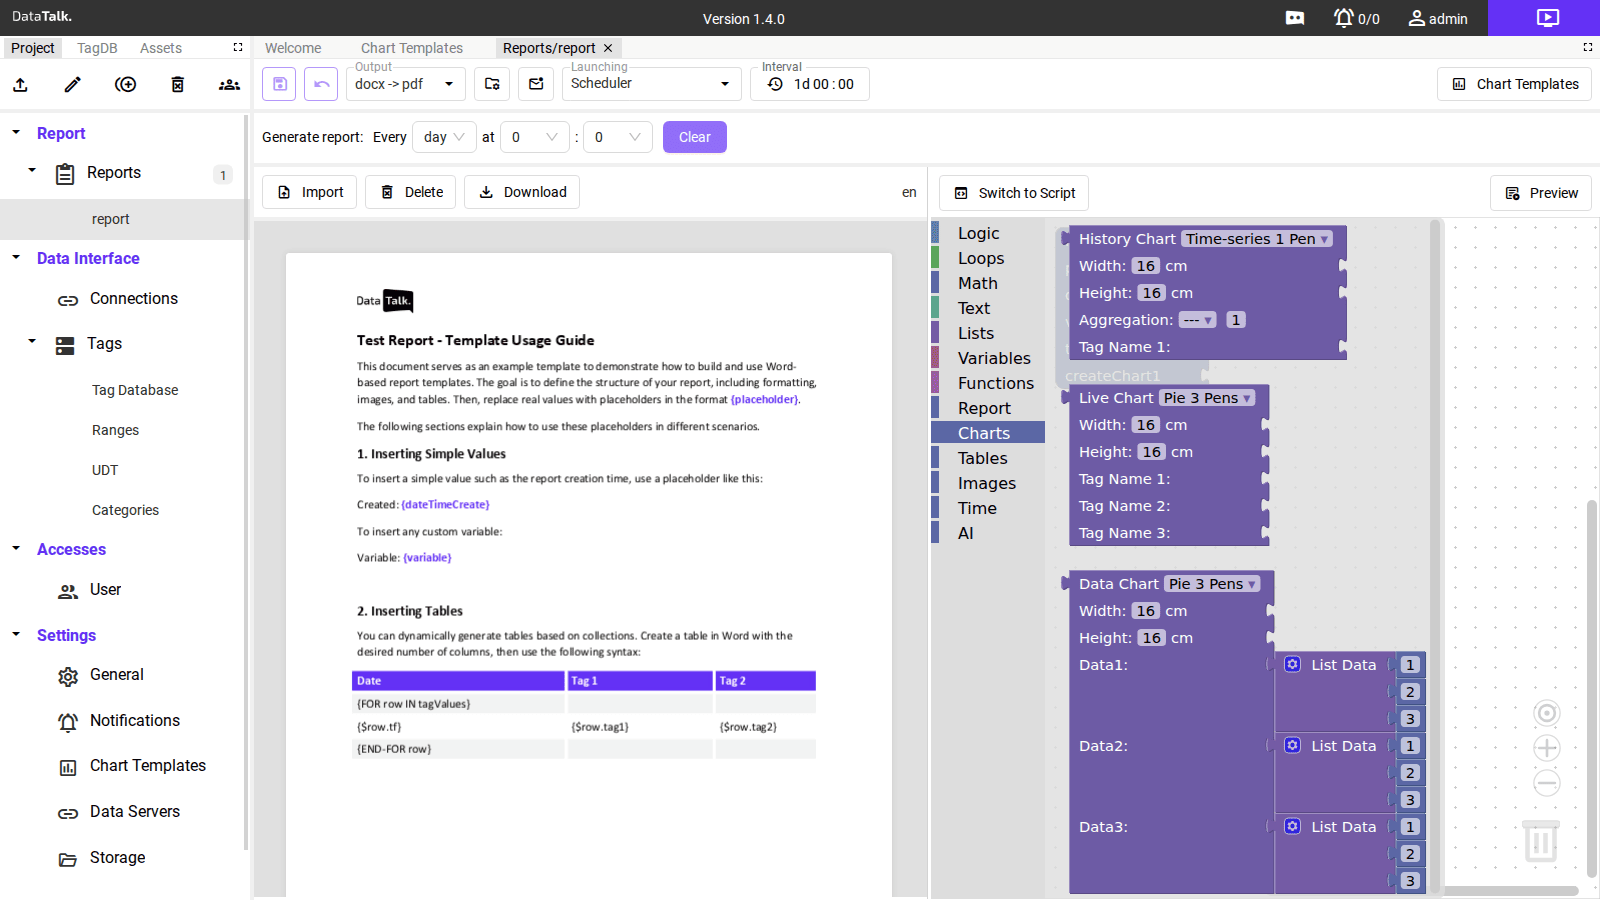
The Charts category inserts rendered chart images into the Word document. The chart is generated at report creation time and embedded as a static image at the placeholder location.
History Chart — renders a chart of historical tag data from the Tag Database for the report time window.
Width — chart image width in centimeters (default: 16 cm).
Height — chart image height in centimeters (default: 16 cm).
Aggregation — time aggregation applied to raw tag data before charting. The dropdown selects the aggregation function (--- = raw data, or averaged over an interval); the number next to it sets the number of aggregation periods.
Tag Name 1, Tag Name 2, … — the tags to plot. Each maps to one Pen in the referenced Chart Template. Type the tag name exactly as defined in the Tag Database.
The chart’s visual style (type, colors, axes, line widths) is inherited from the Chart Template selected when the block is placed. Edit the Chart Template to change the appearance globally across all reports.
Live Chart — renders a chart showing the current (live) state of tag values at report generation time, rather than historical trend data. Uses the same Width, Height, and Tag Name parameters.
Data Chart — renders a chart from explicitly listed numeric values rather than from the Tag Database. Suitable for charts built from pre-computed results.
Width — chart width in centimeters.
Height — chart height in centimeters.
Data1, Data2, Data3 — data series for each Pen. Each Data field has three numbered inputs for entering explicit values or computed expressions. A Pie chart with Data1=40, Data2=35, Data3=25 renders three segments at those proportions.
Tables
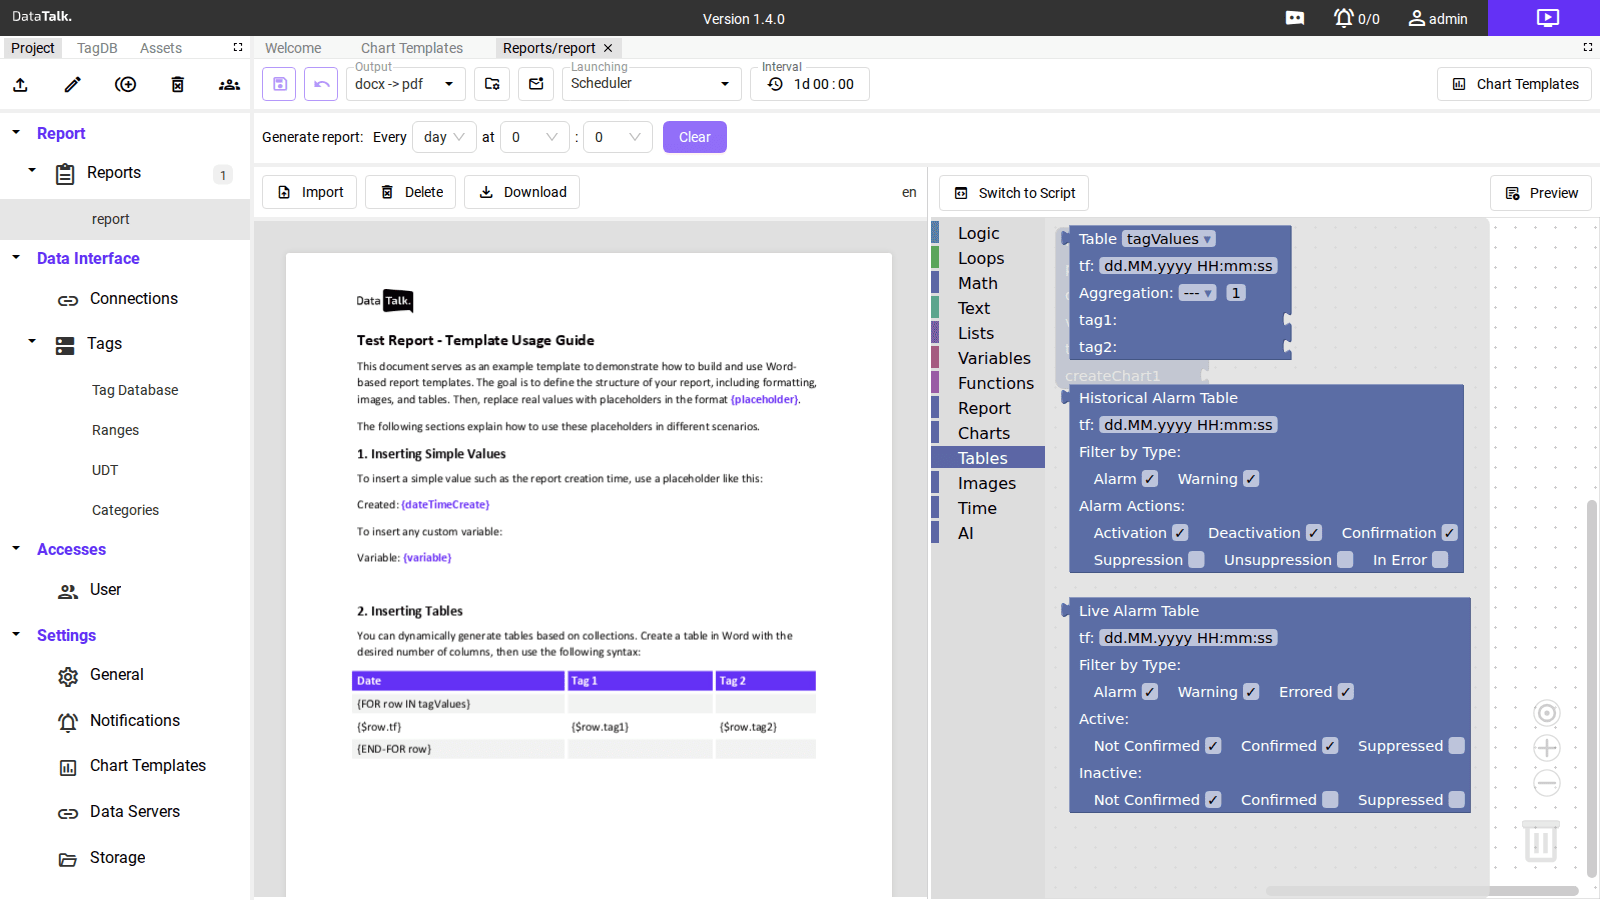
The Tables category inserts multi-row data tables into the Word document. Unlike single-value placeholders, table blocks use the {FOR...END-FOR} loop syntax in a Word table structure to generate one row per data point or alarm event.
Table
Inserts a historical tag value table. Rows come from the Tag Database query for the report’s time window.
tagValues — the data source selector. Determines which tag collection or query the rows come from.
tf — timestamp format string for the date/time column. Default: dd.MM.yyyy HH:mm:ss. Adjust for regional date formats (e.g., MM/dd/yyyy HH:mm:ss for US format).
Aggregation — time aggregation for rows. The dropdown selects the function; the number next to it sets the period count. Raw (---) inserts one row per logged sample.
tag1, tag2, … — the tags to include as data columns. Add as many as the table has columns. These names must match the {$row.tagN} references in the Word table loop.
Word table loop syntax:
| Date                       | Tag 1          | Tag 2          |
| {FOR row IN tagValues}     |                |                |
| {$row.tf}                  | {$row.tag1}    | {$row.tag2}    |
| {END-FOR row}              |                |                |
Historical Alarm Table
Inserts a table of alarm events from the alarm history log. Each row is one alarm lifecycle event that occurred during the report time window.
tf — timestamp format for the Date column (default: dd.MM.yyyy HH:mm:ss).
Filter by Type — select which alarm types to include:
Alarm — alarm-level events.
Warning — warning-level events.
Alarm Actions — select which alarm lifecycle events appear as rows:
Activation — the moment the alarm condition was triggered.
Deactivation — the moment the alarm condition cleared (returned to normal).
Confirmation — the moment an operator acknowledged the alarm.
Suppression — the moment the alarm was suppressed (silenced without resolving the condition).
Unsuppression — the moment suppression was lifted.
In Error — the alarm source entered a communication error state.
Live Alarm Table
Inserts a table of alarms that are active at the moment the report is generated. Useful for a “current alarm status” section at the end of a report.
tf — timestamp format for the Date column.
Filter by Type — include Alarm, Warning, and/or Errored alarms.
Active alarms — filter by acknowledgement state:
Not Confirmed — alarm is active and has not been acknowledged by an operator.
Confirmed — alarm is active and has been acknowledged.
Suppressed — alarm is active but suppressed.
Inactive alarms — alarms that have cleared but not yet been archived. Same Not Confirmed / Confirmed / Suppressed filter options.
Time
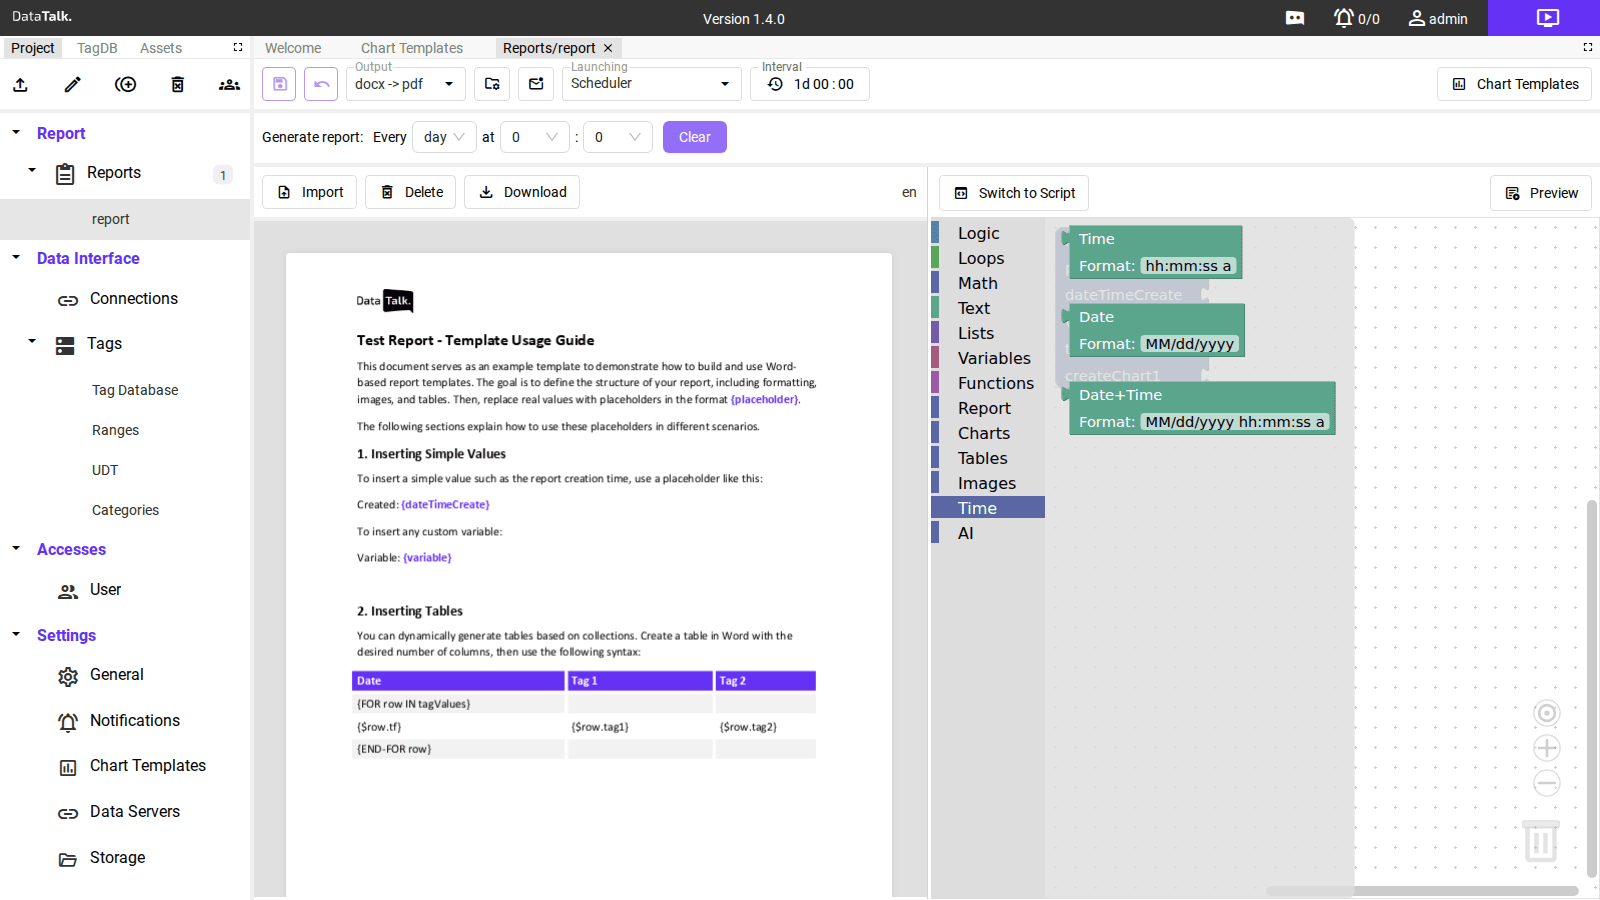
The Time category provides formatted date and time expressions resolved at report generation time.
Time — inserts the time component of the generation timestamp.
Format — format string for the time. Default: hh:mm:ss a (12-hour with AM/PM). Use HH:mm:ss for 24-hour format.
Date — inserts the date component of the generation timestamp.
Format — format string for the date. Default: MM/dd/yyyy. Use dd.MM.yyyy for European format.
Date+Time — inserts the full date and time in a single expression.
Format — format string for the combined value. Default: MM/dd/yyyy hh:mm:ss a.
Common format tokens:
dd — day of month (zero-padded: 01–31).
MM — month number (zero-padded: 01–12).
yyyy — four-digit year.
HH — hour in 24-hour format (00–23).
hh — hour in 12-hour format (01–12).
mm — minutes (00–59).
ss — seconds (00–59).
a — AM/PM indicator.
Logic
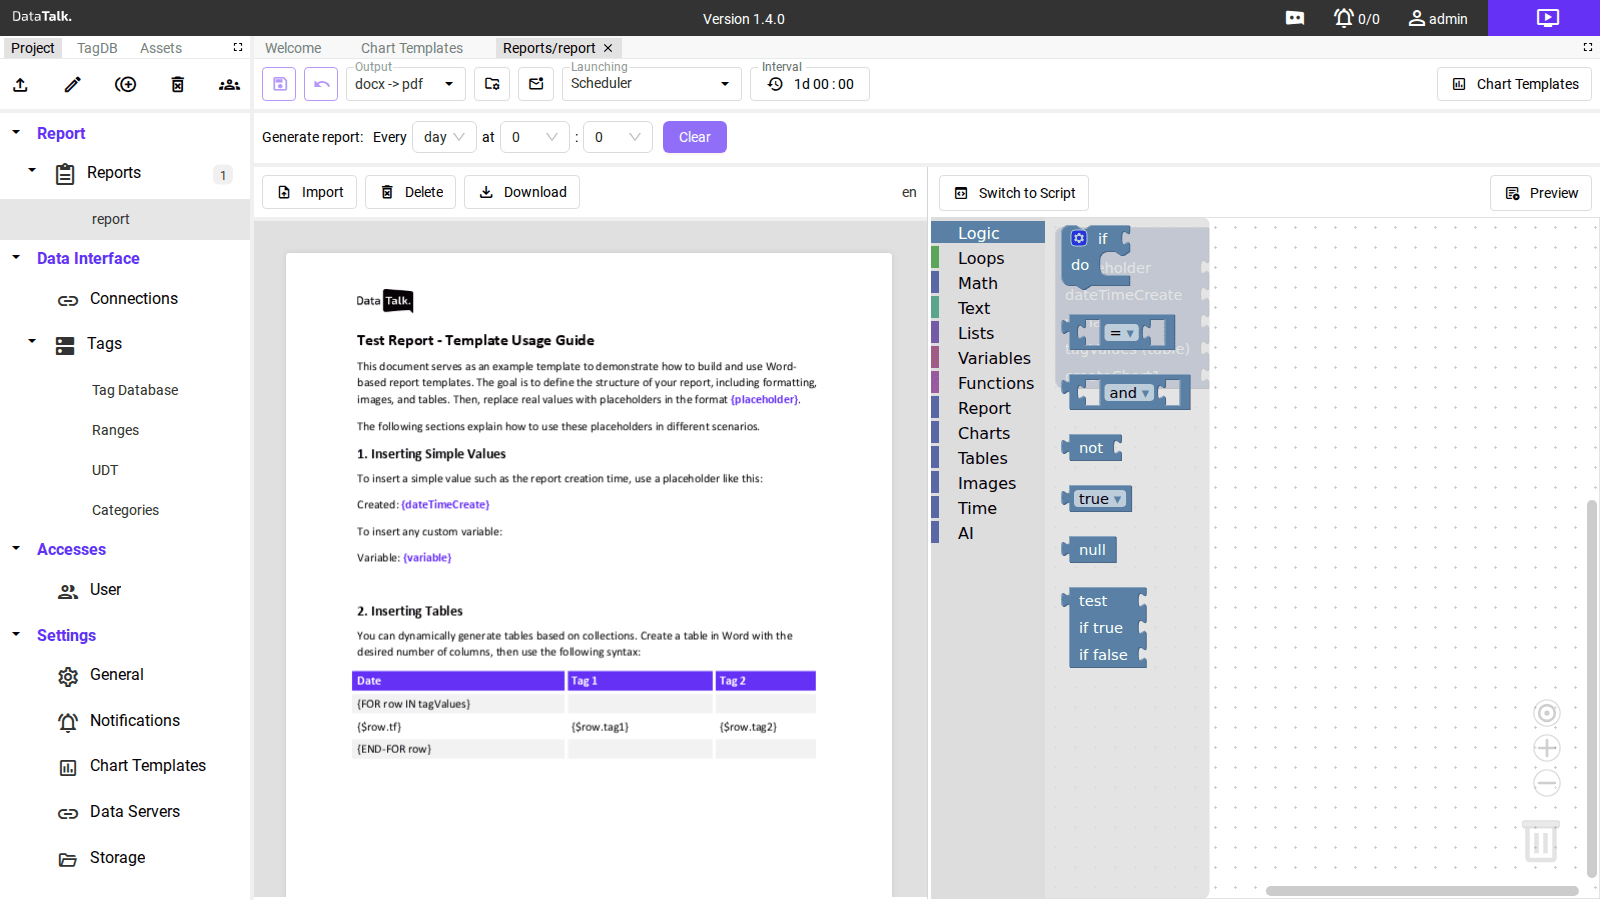
The Logic category provides conditional blocks for showing or hiding content based on computed conditions. Use logic blocks to include a section of the report only when a condition is met — for example, a warning paragraph only when a tag value exceeded its limit during the report period.
if / do — the primary conditional block. The if slot holds the condition; the do slot holds the content to include when the condition evaluates to true.
= (equality) — comparison operator. Returns true when the left and right values are equal. Use inside an if condition.
and — logical AND operator. Both conditions must be true for the combined result to be true.
or — logical OR operator. At least one condition must be true.
not — logical NOT. Inverts the boolean result of its input.
true / false — literal boolean values. Use as explicit constants in conditions.
null — the null/empty value. Use in comparisons to check whether a tag has no logged data during the report window.
test / if true / if false — ternary expression. Evaluates test; returns the if true value when the test passes, the if false value when it does not. Useful for inserting different text labels depending on a tag’s value.
Loops
The Loops category provides iteration blocks for repeating a template section once per item in a collection. The most common use is the {FOR row IN collection}...{END-FOR row} table loop described in Template Design. Use loops for any repeating structure — one paragraph per shift, one section per alarm zone, one row per measurement sample.
Math
The Math category provides arithmetic operations for computing derived values inside the template without a separate TagDB equation:
Addition, subtraction, multiplication, and division of two values.
Rounding, absolute value, floor, and ceiling.
Minimum and maximum over a set of values.
Use math blocks to compute a total energy consumption from individual meter readings, a percentage from two count values, or a difference between the start and end value of a shift.
Text
The Text category provides string manipulation operations:
Concatenation (joining two or more strings).
Substring (extracting part of a string).
Length (number of characters).
Upper case and lower case conversion.
Trim (removing leading and trailing whitespace).
Use text blocks to build dynamic column headers, combine a tag name with a unit suffix, or reformat a value string.
Lists
The Lists category provides operations for working with ordered collections of values:
Create a list with explicit items.
Get the length of a list.
Access a list item by index (zero-based).
Iterate over a list.
Use lists to build the data arrays for Data Chart blocks, or to collect values from multiple tags into a single expression for a summary calculation.
Variables
The Variables category lets you define named values that can be referenced anywhere in the template. Define a variable with a name and an expression (a tag value, a math computation, or a constant), then reference it with {variableName} in the document text.
Variables are computed once per report run and are useful for:
Carrying a value computed in one section through to another part of the document.
Defining a time window boundary (e.g., reportStart = generation time minus 24 hours) and reusing it in multiple chart and table blocks.
Storing an intermediate calculation that appears in multiple places.
Functions
The Functions category contains built-in and project-specific utility functions registered in the system. These may include lookup functions (fetch a value from an external table), conversion functions (unit conversions), or integration results. Available functions depend on the project configuration and installed modules.
Images
The Images category embeds images stored in the project’s Assets library into the report at the placeholder position. Use this for:
Company logo in the report header.
Plant layout diagram as a reference image.
Product photo or process diagram.
Images from the Assets library are stored in the project and embedded as inline content at the exact position of the placeholder in the document. The image dimensions are configured in the block parameters.
AI
The AI category (requires AI module license) generates natural-language text summaries of the logged data and embeds them into the report. An AI block analyzes the tag history for the report period and produces a written paragraph describing trends, anomalies, or production performance — without manual authoring.
Use AI blocks for an executive summary section at the start of a production report, or for an anomaly narrative that explains which tags deviated from their expected ranges and when.