
Introduction
Connect, Log & Report collects data from field devices using any industrial protocol, stores it historically, and turns it into structured PDF reports via a Word document template engine.
Connect, Log & Report collects data from industrial devices using any standard protocol, stores it as historical time-series data, and generates structured PDF reports on a schedule. The reports are built from Word document templates with dynamic {placeholder} expressions — no programming required.
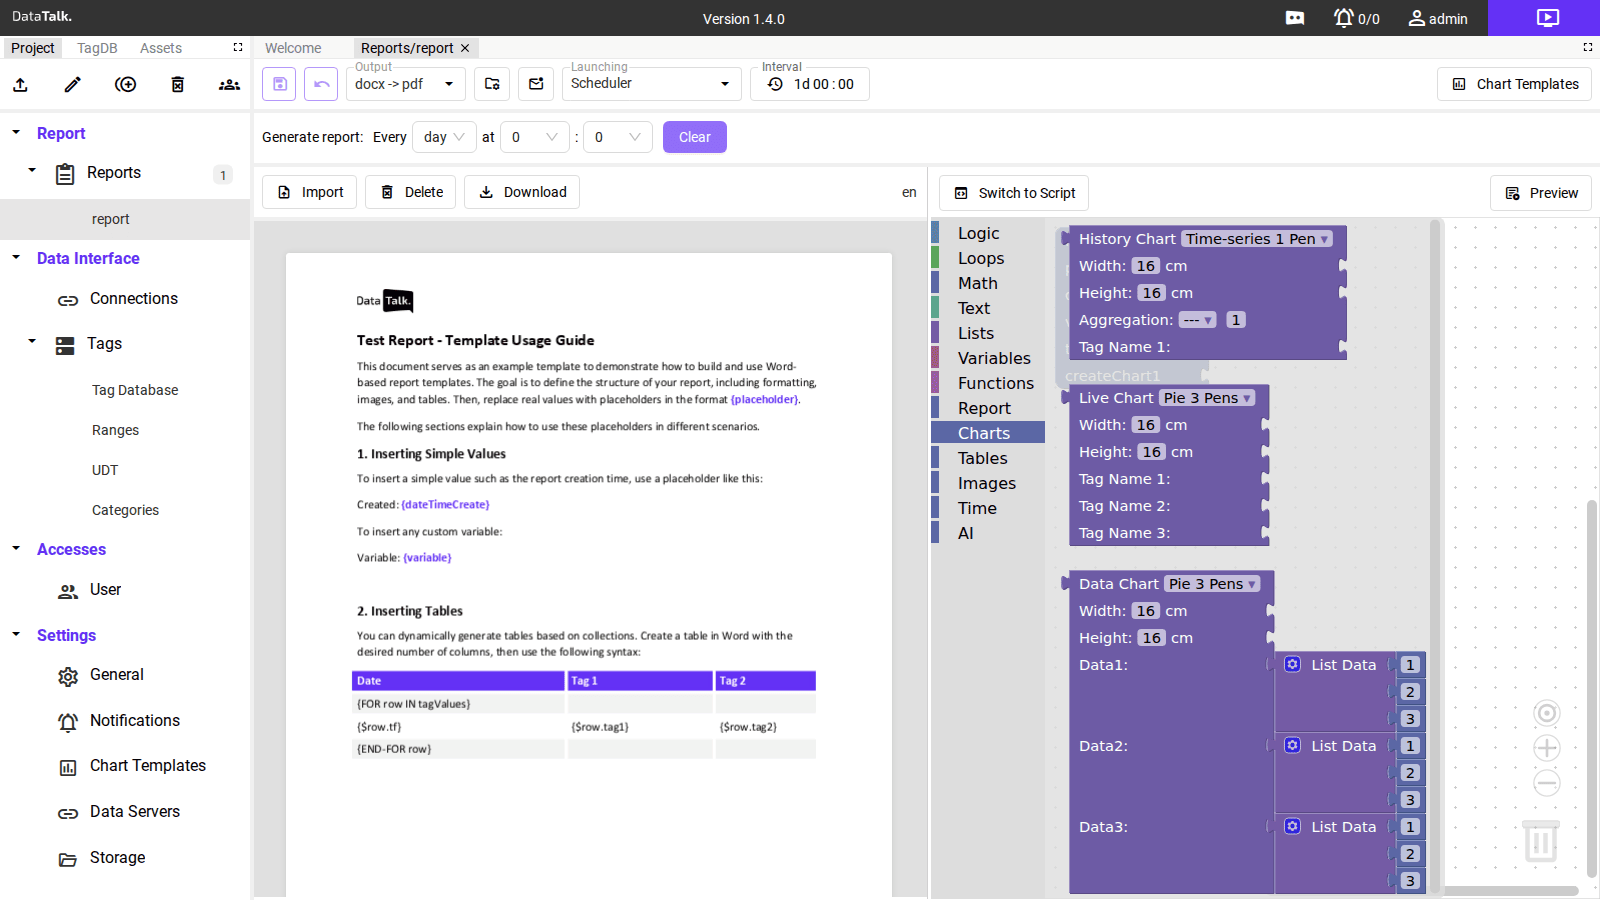
How it works
The application works in three stages:
1 — Connect to OT devices. Define a Connection for each field device or data source. Supported protocols include Modbus TCP/UDP, EtherNet/IP (Allen-Bradley), OPC UA, Siemens OPC UA, MQTT Client, REST API, SQL databases, and local memory registers — all in a single project.
2 — Log data as named Tags. Every value from every device becomes a named Tag in the unified Tag Database. Configure the logging interval, engineering unit, scale factor, and alarm limits per tag.
3 — Generate reports. The Report engine takes a Word document template, replaces each {placeholder} with live or historical data from the Tag Database, and outputs a PDF. Reports run on a schedule (hourly, daily, weekly) and are accessible from the built-in file manager.
What you can put in a report
Reports are not limited to plain text values. The Function Reference covers all block categories:
Charts — embed rendered chart images (time-series lines, bar charts, pie charts) directly into the Word document. Chart style is defined in reusable Chart Templates.
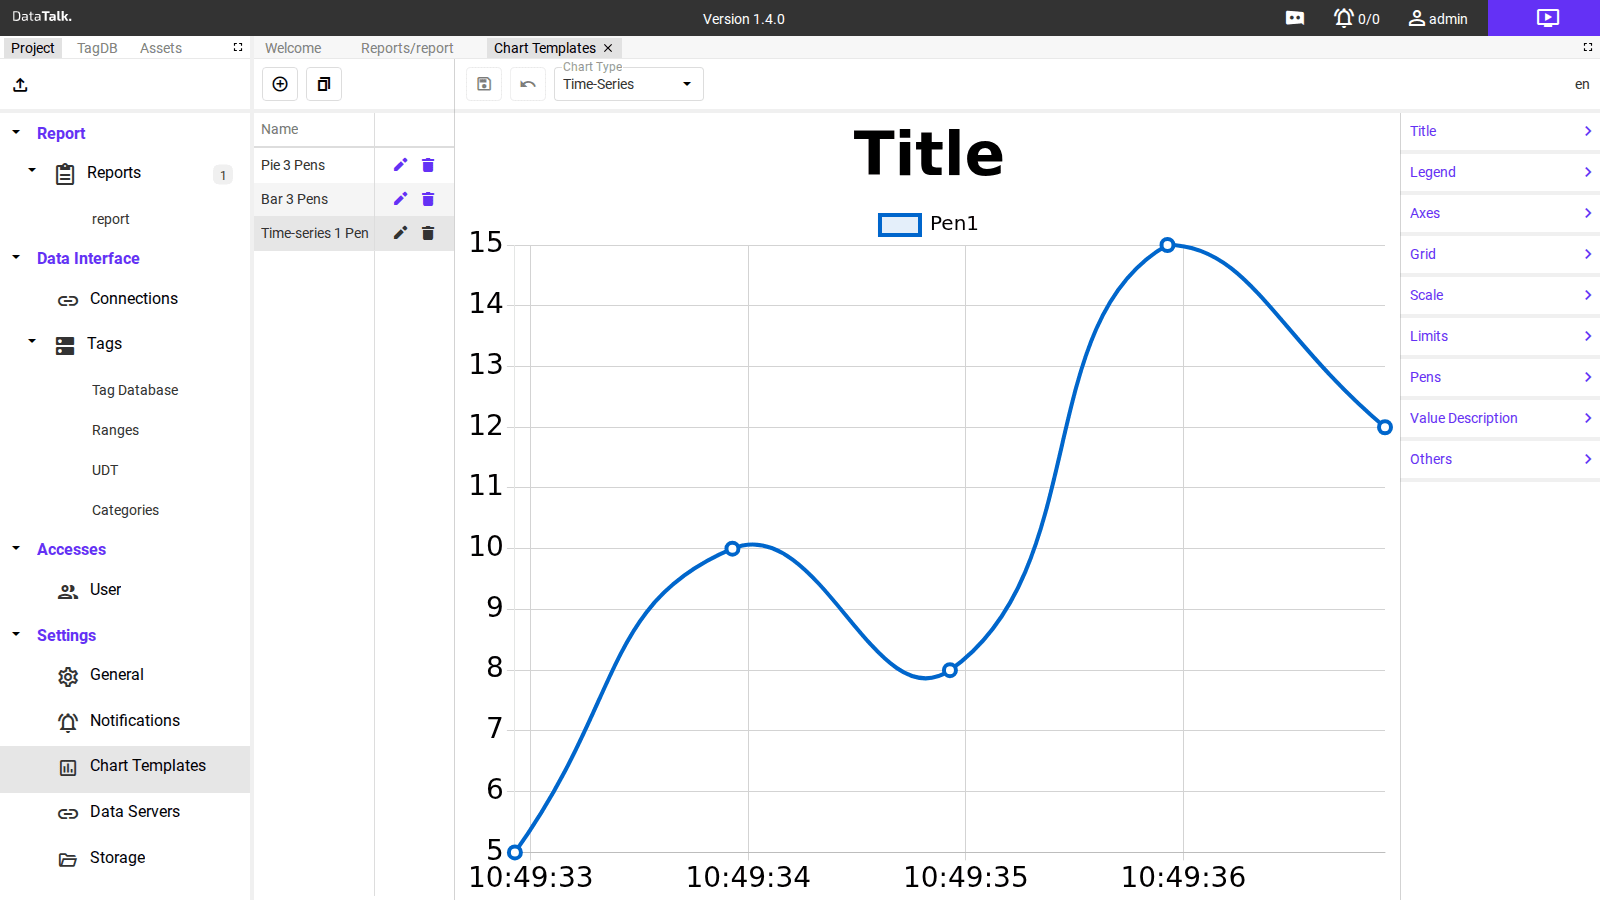
Tables — generate multi-row data tables from tag history using the {FOR row IN tagValues}...{END-FOR row} loop syntax inside a Word table.
Alarm tables — insert historical or live alarm event lists with filters by type, action, and acknowledgement state.
Timestamps — insert report generation time, shift start/end, or any computed date/time value with configurable format strings.
Logic — conditional sections that appear only when a tag value exceeded a limit or a condition was met during the report period.
AI summaries (requires AI module) — automatically generated narrative text describing trends, anomalies, or production performance.
Two interface modes
After login the application opens in View Mode — a file manager showing generated report files and an active alarm list. This is the day-to-day operator view.
Click the pencil icon in the top-right corner to switch to Edit Mode — the full configuration interface where you define connections, tags, report templates, chart templates, users, and all system settings.
Everything in this documentation refers to Edit Mode unless stated otherwise.
Application structure
In Edit Mode, the left panel shows the Project tree organized in four sections:
Report
- Reports — manage report definitions, schedule, and output format
- Template Design — how to author the Word
.docxtemplate with{placeholder}syntax - Function Reference — complete reference for all available blocks
Data Interface
- Connections — protocol connections to OT devices
- Tags — unified Tag Database with logging, scaling, and alarm limits
- Ranges & Limits — alarm limit sets
- UDT — user-defined data types
- Categories — tag grouping
Accesses
- Users — user accounts with role-based permissions and 2FA
Settings
- General — language, startup screen, security
- Notifications — webhook and delivery channels
- Chart Templates — reusable chart presets
- Data Servers — outbound MQTT Broker
- Storage — disk usage and retention
- Backup — project snapshots and restore
Example: what a template looks like
Design the report in Microsoft Word. Insert {placeholder} expressions as plain text where dynamic content should appear. The report editor shows a live preview with placeholders highlighted in purple:
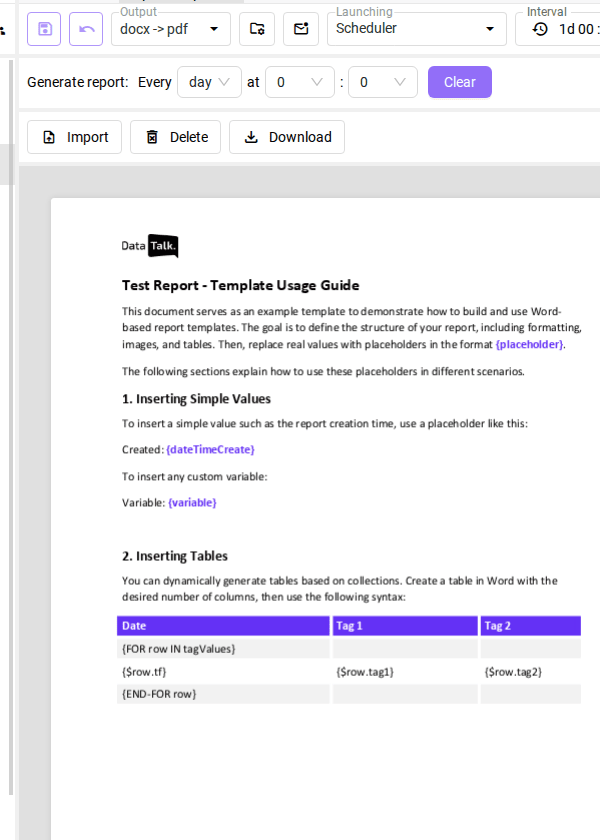
At generation time:
{dateTimeCreate}→27.07.2026 06:00:00{variable}→ the value of any configured variable- The
{FOR row IN tagValues}...{END-FOR row}table loop → one row per logged data point - A History Chart block → a rendered chart image embedded in the PDF at that position
Quick start
Go to Connections and define how the application communicates with your device. Choose the protocol, enter the IP address and port, name the connection, and save.
Open the Tag Database and add the data points you want to log. Map each tag to a register address, set the data type and engineering unit, and enable logging.
Design a .docx file in Microsoft Word. Insert {placeholder} expressions where tag values, timestamps, and charts should appear. Use the {FOR row IN tagValues} loop inside a Word table for multi-row data.
Open Reports and import the .docx template. Set the output format to docx → pdf, launching to Scheduler, and configure the generation interval.
Click Preview to verify the rendered output, then save. Reports generate automatically on schedule and appear in View Mode → Files.
The Tag Database cannot read any values until at least one Connection is defined and shows Online status. Add a Connection first, verify it connects, then proceed to defining Tags.