
Runtime
Start, stop, and configure the DataTalk application runtime process. The runtime must be running for any data acquisition, protocol connections, or data servers to be active.
The Runtime section on the dashboard controls the DataTalk application process that runs on the device. All industrial protocol connections, tag processing, gateway forwarding, and data servers operate inside this runtime. When it is stopped, the device is idle — no data is read, no values are published.
Runtime status
The current state is displayed prominently on the dashboard under the Runtime label.
Not running (shown in red) — the application process is stopped. No connections are polled, no OPC UA or MQTT server is active, no gateway is forwarding data.
Running (shown in green) — the application is active. The header bar turns green and shows System status: OK.
Start / Stop
Two buttons appear next to the Runtime status label:
▶ Play (start) — starts the runtime. A Change Runtime dialog appears briefly showing “Starting runtime…” while the process initializes. After a few seconds the status changes to Running.
⏹ Stop — stops the runtime gracefully. Active connections are closed and all servers shut down.
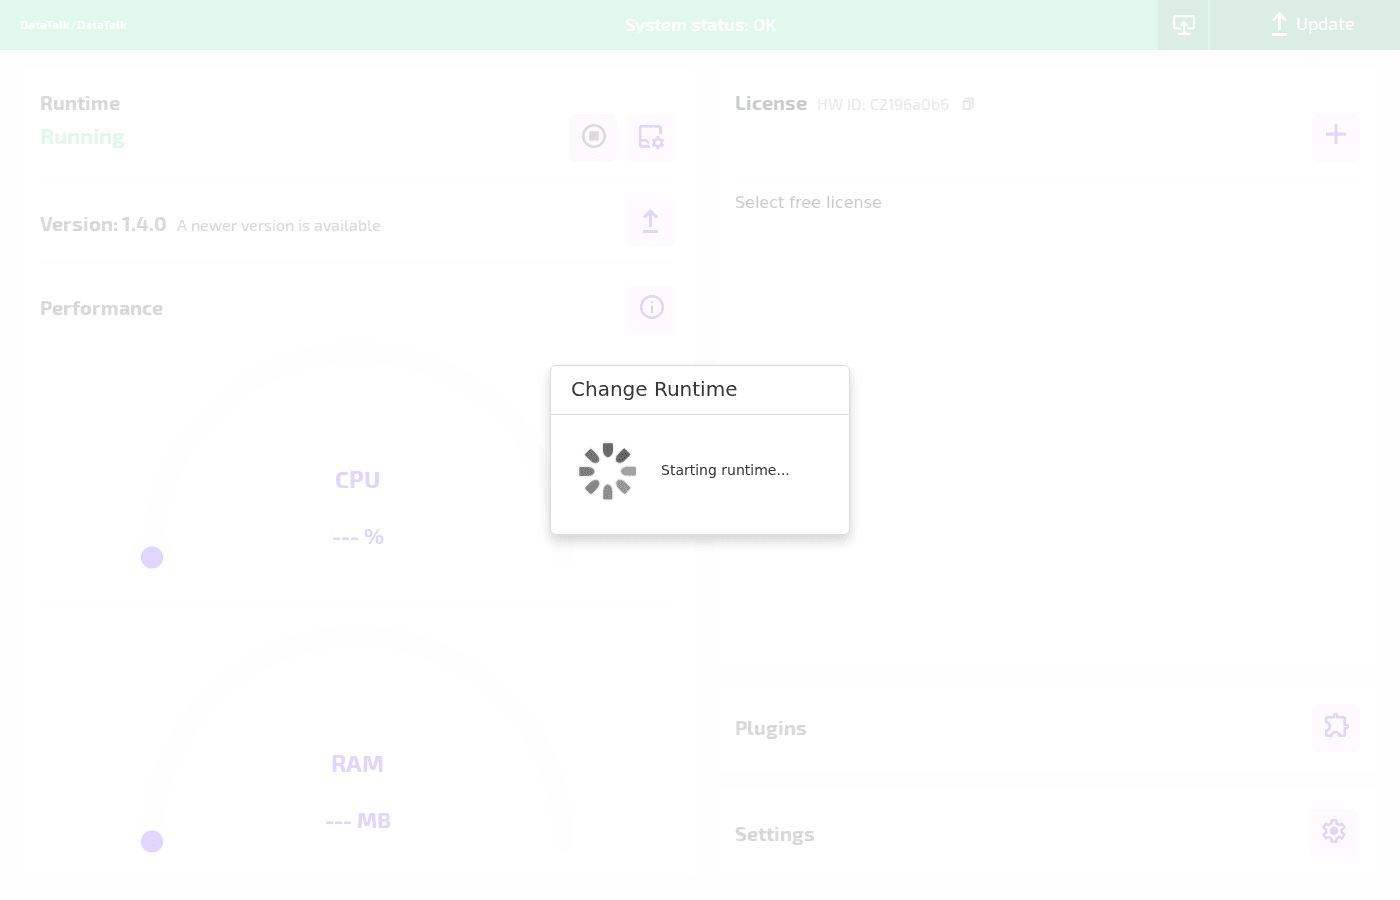
Runtime configuration
The ⚙ configuration button (next to the play button) opens a runtime configuration panel. Use this to set startup behavior — for example, whether the runtime starts automatically when the device powers on.
Version and update
The Version row shows the currently installed DataTalk software version. If a newer version is available from the update server, the message “A newer version is available” appears alongside an ↑ upload button.
To update to a newer version manually:
- Click the ↑ Update button in the top-right corner of the dashboard (or the upload icon next to the version).
- Select the update package file (
.zipor vendor-specific format) using the file picker. - Wait for the upload and installation to complete. The runtime restarts automatically.
Performance
The Performance section shows two live gauge charts:
CPU — current processor utilization as a percentage across all cores.
RAM — current memory consumption in megabytes.
Clicking the ⓘ info button opens the detailed process view.
Process list
The process list shows all individual services managed by DataTalk Manager, including their current status, CPU core usage, and memory consumption.
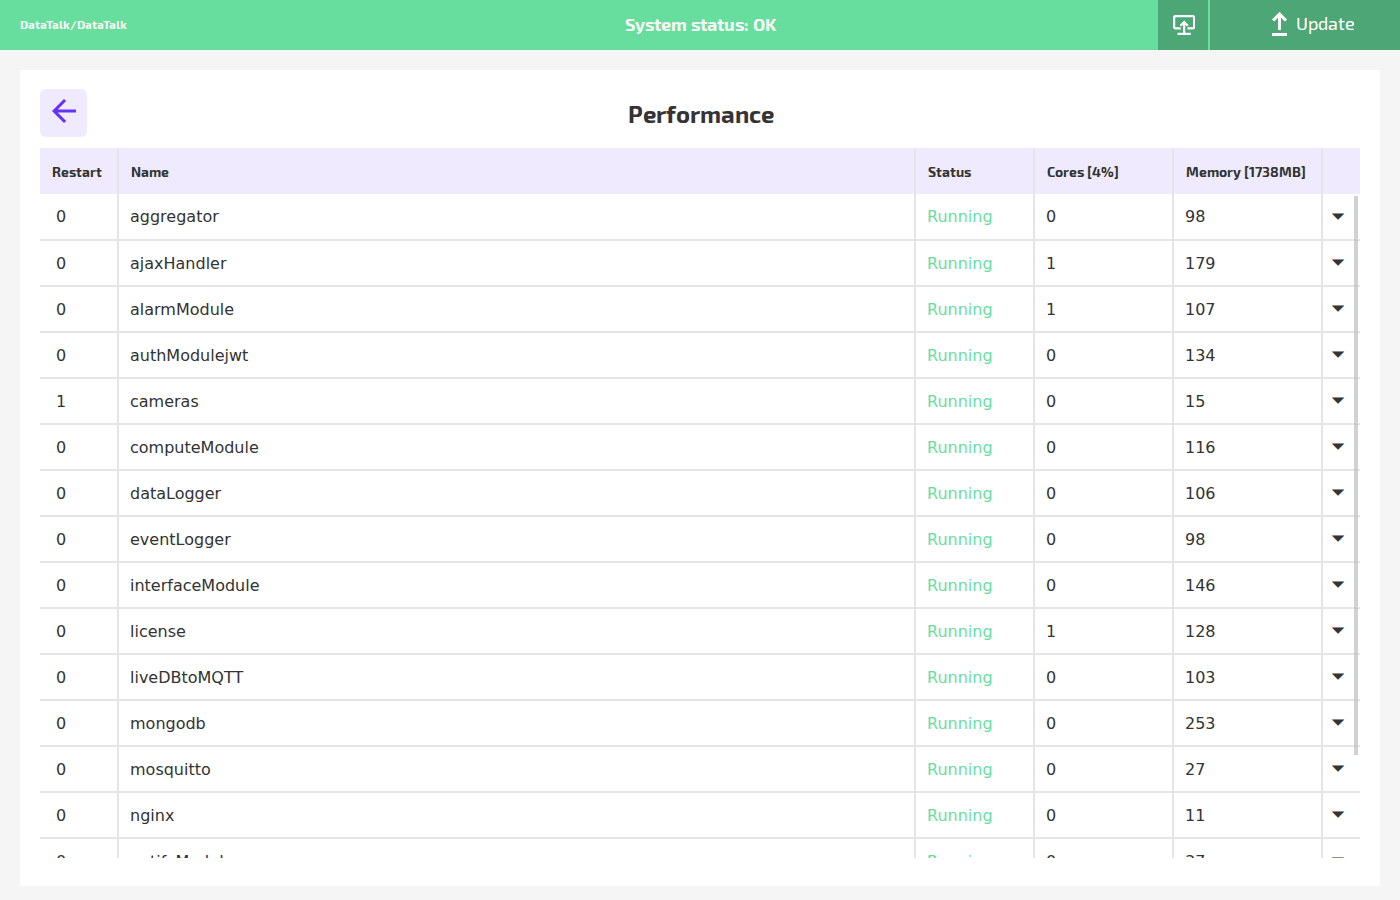
Each row represents one service. The Restart button on the left restarts that specific service without stopping the entire runtime. This is useful for recovering a single crashed service without interrupting the rest of the system.
Columns:
Restart — restarts the individual service.
Name — the internal service identifier.
Status — current state (running, stopped, error).
Cores [%] — CPU load attributed to this service, expressed as a percentage of one core.
Memory [MB] — RAM allocated to this service.