
Animations
Bind element properties to tags so that colors, rotation, visibility and opacity change with live values — using the limits and parameters defined once in the Tag Database.
On this page
Animations make a view alive. Any element property that has an A (Animation) button beside it can be linked to a tag, and the element then changes automatically when the tag value changes.
Animation behavior is calculated from the current tag value and from the parameters configured for that tag. This means that animation logic does not need to be configured separately in each view: the Tag Database is the central place for defining the parameters that determine how a tag is visually represented.
Adding an animation
Select the element in the canvas or in the layer tree.
Click the A (Animation) button next to the property you want to animate — for example next to Fill in the Color section. The animation settings unfold below the property.
Drag a tag from the TagDB tab into the Tag field. In a parametric view the tag can contain a placeholder such as Global memory.{2} — see Parameters.
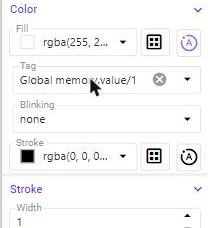
Set the remaining options of the property — for example Blinking, or Center ID and Range for rotation.
Click A again to switch the animation off.
Animatable properties
| Property | Where | Settings |
|---|---|---|
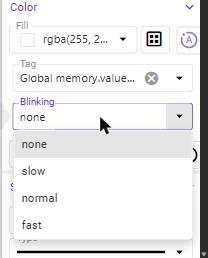
| Fill | Color | Tag, Blinking (none, slow, normal, fast) |
| Stroke | Color | Tag |
| Rotation | Transform | Tag, Center ID (pivot element), Range (total angle in degrees, default 180) |
| Visible | Visibility | A button |
| Opacity | Visibility | A button |
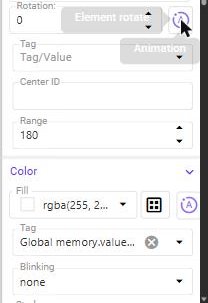
Rotation is used for needles, pointers and rotating symbols. The tag value between its minimum and maximum is mapped onto the Range in degrees and the element turns around the center of the element whose ID you enter in Center ID.
Animations use the limits from the Tag Database
An animation evaluates the current value against the limits configured for the tag. A tag can have predefined alarm limits such as:
- HH (High-High)
- H (High)
- L (Low)
- LL (Low-Low)
For example, when a value exceeds the HH limit, an animated color property can automatically change to red. This approach allows the same tag to behave consistently across different views, dashboards, charts and other visualizations.
Example
If a temperature tag is configured in the Tag Database with:
HH = 90 °C
H  = 80 °C
L  = 20 °C
LL = 10 °C
an animation can automatically represent the tag state according to these limits:
Value > HH  → red
Value > H   → high-state indication
Value < L   → low-state indication
Value < LL  → critical low-state indication
The exact visual representation depends on the animation configured for the element. Limits are defined in Ranges & Limits and assigned to tags in the Tags page.
Centralized tag configuration
Because animation evaluation uses the parameters defined in the Tag Database, important process limits and tag-specific parameters should be configured at the tag level rather than duplicated in individual views. This provides two important benefits:
Consistency — the same tag behaves consistently wherever it is displayed.
Reusability — reusable views and faceplates automatically adapt to different tags without requiring separate animation logic for each instance.
For example, a reusable motor faceplate can use the same animation rules for all motors. Each motor’s tag configuration provides the relevant limits and parameters, while the faceplate automatically applies the appropriate visual state.
Showing live values in text
A text element can display a live tag value. Write a numbered placeholder such as {1} in the Text field — a Tag/Value selector labelled with the placeholder appears below it. Choose the tag there — drag it from the TagDB tab into the field.
{1} %
Inside a tag path, {1} is replaced by the first view parameter. Inside a text, {1} marks the place where the value of a tag is inserted, while ${1} inserts the first view parameter itself. See Parameters.