
Introduction
Web HMI is a DataTalk module for building live operator screens — vector Views with animations, commands and parameters — together with dashboards, charts, tables and alarms.
On this page
Web HMI is a DataTalk module for building operator screens that run in any web browser. Where a dashboard arranges ready-made components on a canvas, a View is a screen you draw yourself: tanks, pumps, motors, pipes, buttons and labels are vector elements that change color, position, size or visibility according to live tag values, and that can write values back to the process when the operator clicks them.
What is new compared to Real time Dashboards
Web HMI contains everything that Real time Dashboards offers — Dashboards, Charts, Live Charts, Tables, Alarms, Documents, the Assets library and the complete Data Interface — and adds Views:
Draw your own screens — the View editor is a vector drawing tool with rectangles, ellipses, paths, lines and text, a layer tree, alignment tools, guides and a grid. You can also import ready-made SVG graphics.
Animate elements from live data — any element property (fill, stroke, opacity, position, size, rotation, visibility) can be bound to a tag. The result is calculated from the tag value and from the limits and parameters configured in the Tag Database, so the same tag looks and behaves the same in every view.
Control the process — any element can be turned into a button using Set commands (write a fixed value, ask the operator for a value, increment, decrement or toggle) and Open commands (switch to another view, open a chart, a dashboard, or show a popup).
Reuse one view many times with parameters — define parameters such as {1} and use them inside tag names. One Motor view then serves ten motors: you only pass a different parameter value when the view is opened.
Automate with scripts — a view can run a script for operations that go beyond a single tag write.
Editor overview
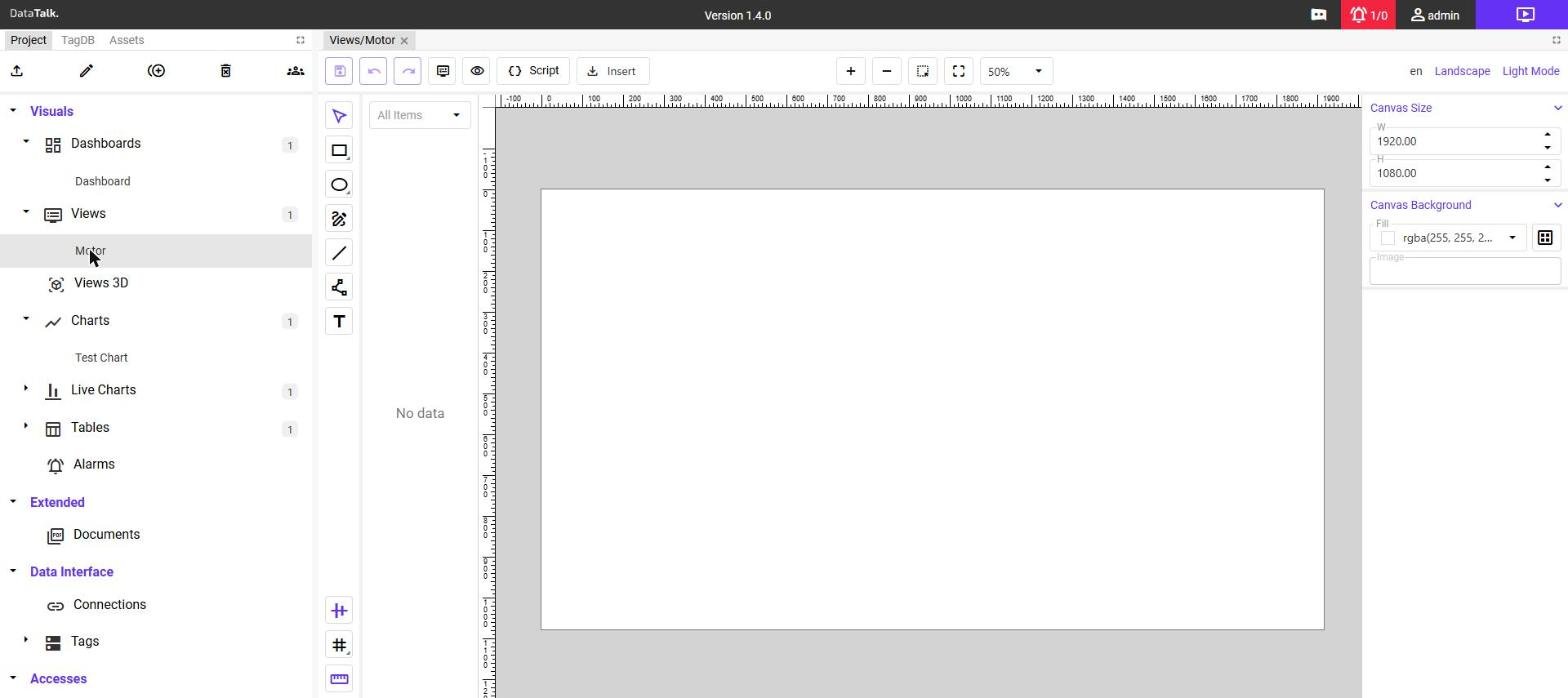
The editor is part of DataTalk Manager v1.4.0 and later and opens as a web application from any browser on the local network. A purple button in the top-right corner switches between view mode (the running application) and edit mode.
In edit mode the page is organized around three areas:
Left panel — three tabs: Project (the navigation tree with Visuals, Extended, Data Interface, Accesses and Settings), TagDB (the Tag Database, from where you drag tags into properties) and Assets (the component library).
Document tabs — every item you open for editing (a view, a dashboard, a chart…) gets its own tab, similar to a code editor.
Editing area — the canvas of the active item together with its toolbar and properties panel.
Main workflow
- Configure a Connection under Data Interface so the application can reach your devices.
- Make sure the Tags you need exist in the Tag Database, and set their Ranges & Limits (HH, H, L, LL) — animations use them automatically.
- Create a View under Visuals → Views and draw the screen.
- Bind element properties to tags with animations, and add Set or Open commands where operators need to interact.
- If the same screen is needed for several machines, define parameters and use them in tag names.
- Switch to view mode to see the screen running live.
The pages in the Views section describe each of these steps in detail. Dashboards, charts, tables and the remaining sections work exactly as in Real time Dashboards.