
Tutorial — Reusable Motor Faceplate
Build a Motor faceplate with a symbol from the P&ID library, a live trend and three control buttons, and a Plant Overview that opens it with a parameter.
On this page
This tutorial builds a small but complete operator interface:
- a Motor view — one faceplate with a motor symbol, a live load value, a trend and three buttons (−, ON / OFF, +), reusable for any motor,
- a Plant Overview view — a screen with five tiles; a click on a tile opens the same faceplate for that motor.
It uses tags of the Global memory connection, so you can follow it without a device. Every motor has its own pair of tags:
| Motor | Load tag | Run tag |
|---|---|---|
| 1 | value | valve |
| 2 | value2 | valve2 |
| 3 | value3 | valve3 |
| 4 | value4 | valve4 |
| 5 | value5 | valve5 |
The load tags are numeric (int, 0–100 %) and have logging switched on, so the chart can draw their history. In a real project you would use the tags of your machines — for example machine.motor3.load and machine.motor3.run.
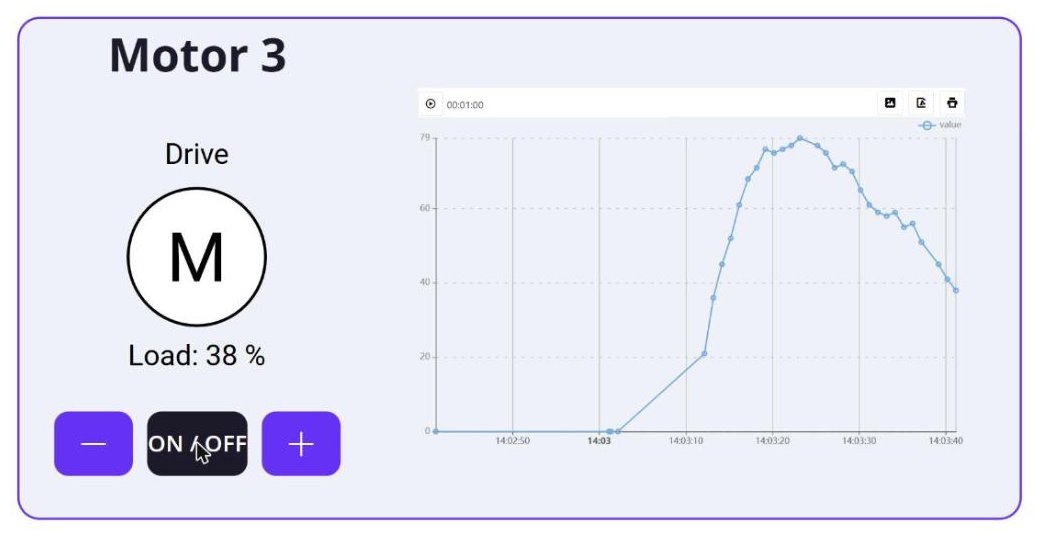
The faceplate contains no fixed tag. Three view parameters — the motor number, the name of the load tag and the name of the run tag — are filled in by the Open command of the tile that was clicked. See Parameters.
Part 1 — The Motor view
In edit mode click Views in the Project tree, click +, enter the name Motor and click Save. Double-click the new view to open it. See Views.
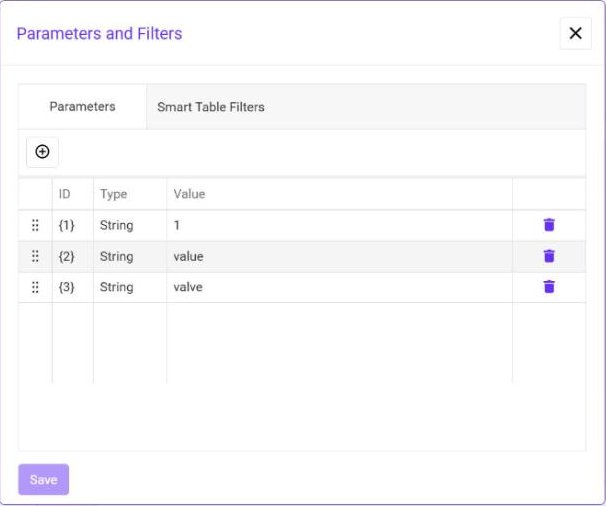
Click Parameters in the toolbar and add three parameters with +: {1} = 1 (motor number), {2} = value (load tag) and {3} = valve (run tag). The default values must be names of existing tags — the tag fields accept a placeholder only then. Click Save in the dialog and save the view. See Parameters.
Draw a Rectangle for the body of the faceplate. Give it a light Fill, a Corner Radius and a Stroke in the brand color. Add a Text at the top with the content Motor ${1}; ${1} is replaced by the parameter value, so the title reads Motor 3 when the view is opened with parameter 3.
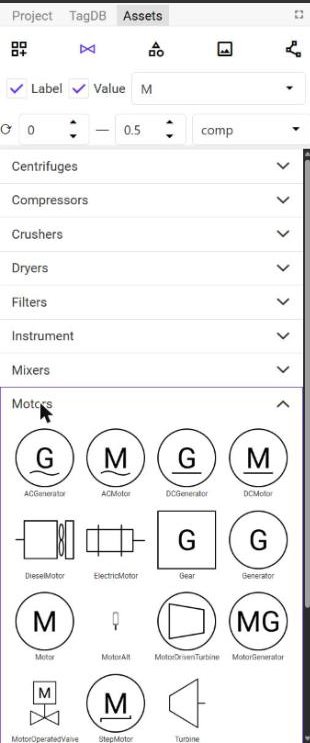
Open the Assets tab, click the P&ID icon and expand the Motors category. Drag the Motor symbol onto the canvas. See View Editor.
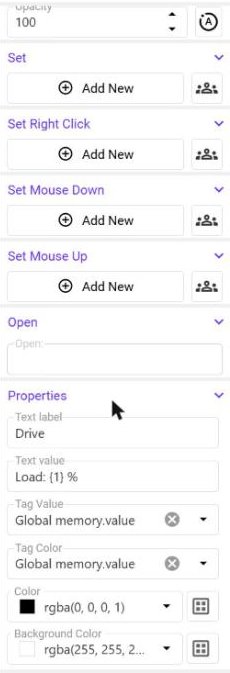
Select the symbol and scroll the properties panel to Properties. Enter Drive as Text label, Load: {1} % as Text value and type Global memory.{2} into Tag Value and Tag Color. The symbol shows the live load of whichever motor the view was opened for.
Drag the Motor Load chart from the Project tree onto the canvas next to the symbol. It shows the trend of the load tag — see Chart with a live trend below.
Draw three rounded rectangles under the symbol and place a text on each of them: −, ON / OFF and +. Center each text horizontally and vertically on its button.
Give each button a Set command — see Button commands below.
Click Save.
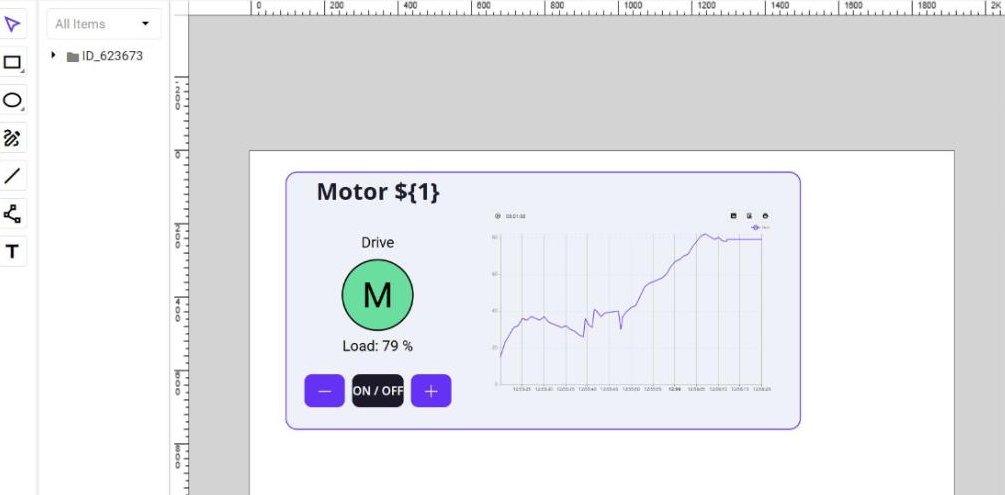
Chart with a live trend
A chart can be placed inside a view exactly like any other element: drag it from the Project tree onto the canvas. To show a running trend, create a classic chart (Charts, not Live Charts — a live chart shows only the current value of a tag, without any history):
- In the Project tree click Charts, click +, name the chart
Motor Loadand open it. - Open the chart Parameters dialog (toolbar) and add
{1}=1and{2}=value. Parameters are matched by their number, so{2}receives the same load tag as{2}of the view. - Click Add Tag and type
Global memory.{2}into the Tag field. - Set Mode to Live&Hist. The chart draws the live values of the last minute.
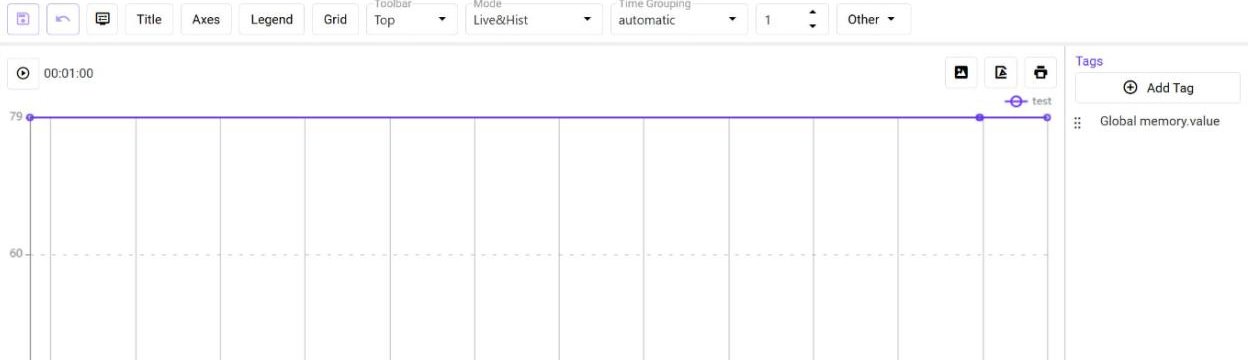
A trend needs the values to be recorded. Enable Log for the load tags in the Tag Database (value … value5).
Button commands
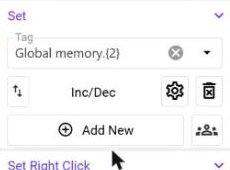
Select a button rectangle and use the Set section of the properties panel. See Set Commands.
| Button | Tag | Method | Settings |
|---|---|---|---|
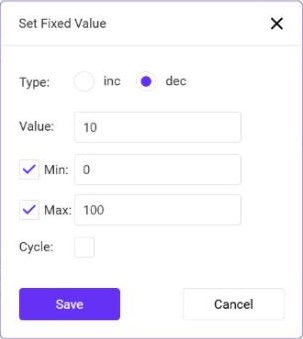
| − | Global memory.{2} | Inc/Dec | type dec, value 10, Min 0, Max 100 |
| ON / OFF | Global memory.{3} | Toggle Value | — |
| + | Global memory.{2} | Inc/Dec | type inc, value 10, Min 0, Max 100 |
Type the tag into the Tag field of the Set section, for example Global memory.{2}. The text of the ON / OFF button needs the same command as its rectangle — a click on the letters reaches the text, not the rectangle.
The limits keep the load between 0 and 100 %, so repeated clicks on + stop at 100.
Simulation script
Without a machine nothing changes the load, so the trend would stay flat. A short view script plays the role of the motor: while the run tag is 1 the load follows a slow wave with some noise, when it is 0 the load falls to zero. The − and + buttons still work, because the script moves the current value towards its target instead of overwriting it. The script reads the parameters of the view with helper.getProperties() — the second parameter is the load tag and the third one the run tag.
Click Script in the toolbar and enter:
//called when view is first rendered
this.init = async () => {
  //parameters of the view: {2} = load tag name, {3} = run tag name (e.g. value2, valve2)
  const p = await helper.getProperties();
  const param = (i, def) => {
    const x = Array.isArray(p) ? p[i] : undefined;
    if (x === undefined || x === null) return def;
    return typeof x === 'object' ? (x.value ?? def) : x;
  };
  const loadTag = 'Global memory.' + param(1, 'value');
  const runTag = 'Global memory.' + param(2, 'valve');
  //simulated motor: ON/OFF is the run tag, load follows a slow wave, - and + buttons change it
  this.t = 0;
  this.timer = setInterval(async () => {
    this.t += 1;
    const running = Number(await helper.readTagValue(runTag)) === 1;
    let load = Number(await helper.readTagValue(loadTag)) || 0;
    const target = running ? 55 + 25 * Math.sin(this.t / 10) : 0;
    load += (target - load) * 0.25 + (running ? (Math.random() - 0.5) * 6 : 0);
    load = Math.max(0, Math.min(100, Math.round(load)));
    await helper.writeTagValues({ [loadTag]: load });
  }, 1000);
}

//called when view is destroyed
//free all resources such as timers here
this.destroy = async () => {
  clearInterval(this.timer);
}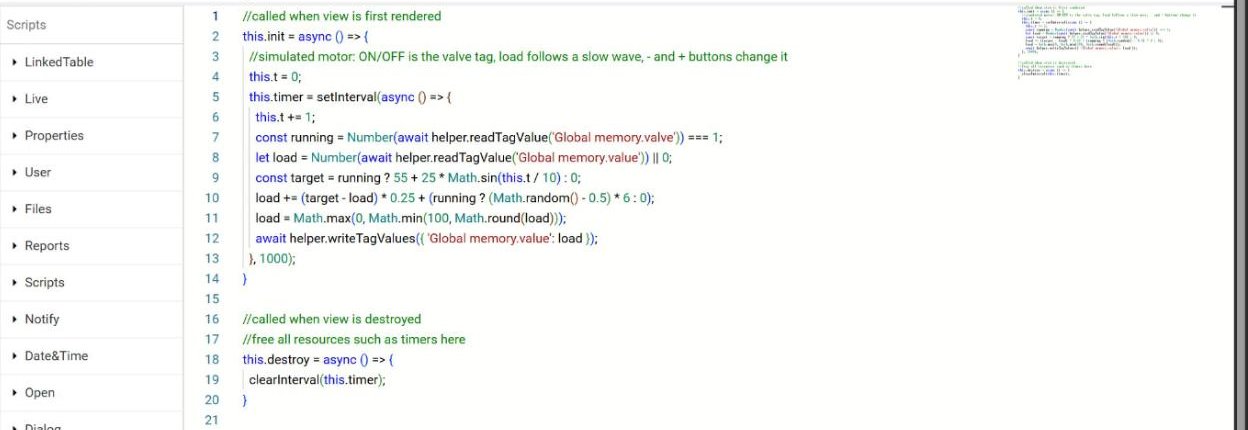
The timer is started in this.init and stopped in this.destroy. See View Scripts.
With a real machine the script is not needed — the PLC writes the load and the state, and the faceplate only displays and commands them.
Part 2 — The Plant Overview
The overview is an ordinary view with five tiles. Every tile is a rectangle with an Open command; a label sits below the tile, so that no text covers the clickable area.
Add a second view named Plant Overview and open it. Add a title text.
Draw a rectangle (for example 300 × 240 with a corner radius of 24), give it a fill and a stroke and add the label Motor 1 under it. A newly drawn rectangle takes over the style of the previous one, so the other tiles only need a position.
Select the rectangle. Scroll the properties panel to Open and drag the Motor view from the Project tree onto the Open field. See Open Commands.
Click the gear and open the Parameters tab. The three parameters of the Motor view are listed. Enter the values of this motor — for motor 3: 3, value3, valve3. Click Save.
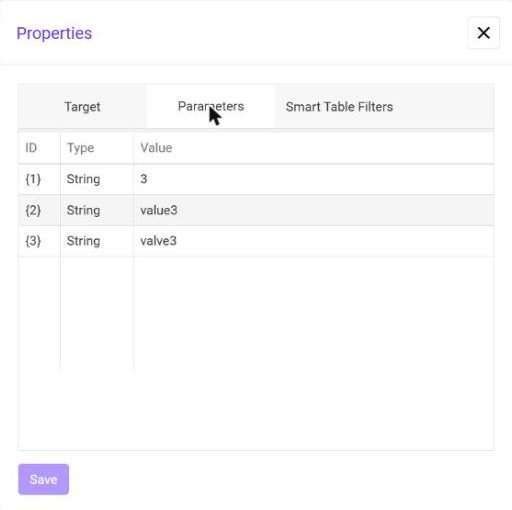
Create four more tiles with labels Motor 2 … Motor 5 and give each one the same Open command with its own values: 2/value2/valve2, 4/value4/valve4, 5/value5/valve5. Save the view.
Part 3 — Try it
Leave edit mode and open Views → Plant Overview from the navigation menu.
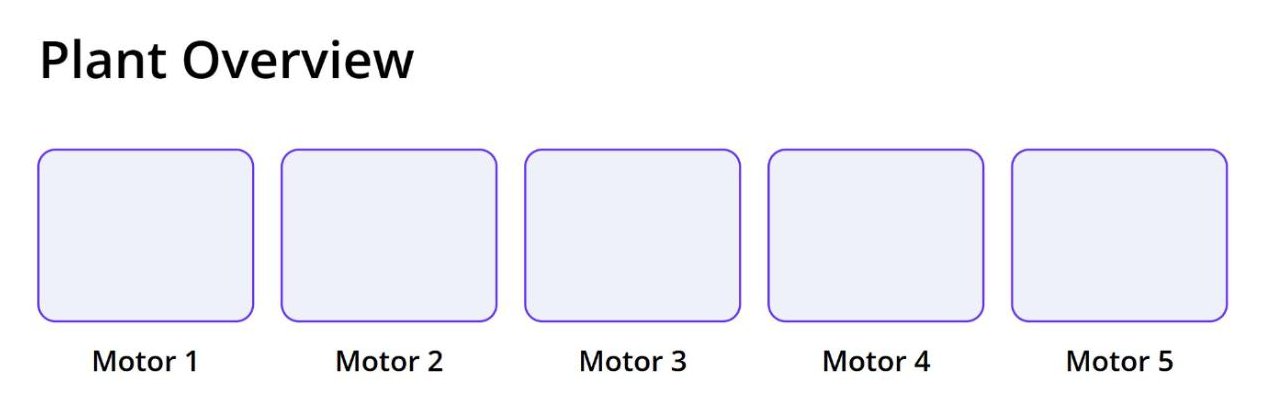
Click a tile: the Motor view opens with the parameters of that tile — the title reads Motor 3, the symbol, the buttons and the trend work with value3 and valve3. Click ON / OFF to start the motor and watch the load and the trend; + and − change the load by 10 %. Go back to the overview and open another motor: the same faceplate now shows the data of that motor.
You maintain one faceplate, and every change to it is visible for all motors. To add a sixth motor, create its tags and add one more tile with its own parameter values.