
Quick Start
On this page
This guide walks through the minimum steps to go from a fresh installation to a working alarm system: connect to a device, read tag values, define alarm limits, receive notifications, and query the system through the AI assistant.
All configuration steps happen in Edit Mode. Enter it by clicking the pencil icon at the top right of the top bar.
Navigate to Data Interface → Connections.
Click the Add Connection tile, enter a name for the connection, and click Set. The application creates the connection and adds it as a tile on the page.
Double-click the tile to open its configuration. Set the protocol-specific parameters — for example, the PLC IP address for an EtherNet/IP connection.
Navigate to Data Interface → Tags → Tag Database.
Add tags from the connection you created. Each tag maps one data point on the device — a register, a bit, an analog value — to a named variable inside the application.
The toolbar shows how many tags you have defined against the limit for your licence (for example, 2/50).
In Tag Database, select a tag and click the Limits button in the toolbar.
Define one or more thresholds for that tag:
HH — high-high alarm. The most severe high-side condition.
H — high warning. A caution level before the alarm triggers.
L — low warning. A caution level on the low side.
LL — low-low alarm. The most severe low-side condition.
Enter the threshold value and the alarm message text for each level you want to use, then save. Once saved, the application automatically generates an alarm event whenever the tag value crosses a configured threshold.
You do not need to set all four thresholds. Configure only the levels that are meaningful for each tag.
Navigate to Settings → Notifications.
First create a group: click Add Group, type a name (e.g. Operations), and save. The group appears in the left panel.
Select the group, then click Add Notification. A form opens on the right:
Name — a label for this channel, e.g. Telegram – Maintenance team.
Type — the notification service. Supported options include email/SMTP, Telegram, Slack, Microsoft Teams, Discord, ntfy, and all services available through the Apprise library.
URL — the Apprise connection URL for the selected service. The URL encodes credentials and routing in a single string. Examples:
- Telegram:
tgram://BotToken/ChatID/ - Email:
mailto://user:[email protected] - ntfy:
ntfy://mytopic/ - Slack: paste the incoming webhook URL directly
User Groups — which user groups receive this notification.
Users — individual users to notify in addition to the group.
Save. The notification is now listed under the group. When a tag’s alarm limit is crossed, the application sends an alert to every channel in the assigned group.
Notification groups are assigned when configuring alarm limits on a tag (Tag Database → Limits). Select the group in the alarm limit form to activate delivery for that alarm.
Navigate to Settings → AI → System Description.
The AI assistant automatically receives live tag values and active alarms as context for every question. To make its answers more accurate and relevant, describe your installation in the text field:
- What the facility or machine does
- What the connected tags represent (e.g. “Tag
TIC-101is the reactor inlet temperature in °C”) - Any naming conventions (e.g. “All tags starting with
TICare temperature controllers”) - Preferred units and alarm escalation rules
When asking questions, reference specific tags by name in double quotes: “What is the current value of "TIC-101"?” — the AI treats quoted names as exact tag identifiers.
In Settings → AI → Advanced you can control how many live tags and alarm records the AI receives per query. Raise the limits if the AI is missing relevant data; lower them if responses are slow.
Navigate to Settings → AI → Config.
Check Enable, then select a Type:
OpenAI — enter your API key and select a model (for example, gpt-4o).
Ollama — point to your local Ollama instance.
Save. The brain icon in the top bar of View Mode is now active. Click it to open the AI Assistent panel and ask plain-language questions about current alarms and tag values.
What you have now
After completing these steps the application continuously reads tag values from the connected device, triggers alarm events when values cross the thresholds you defined, and delivers notifications through the configured channel.
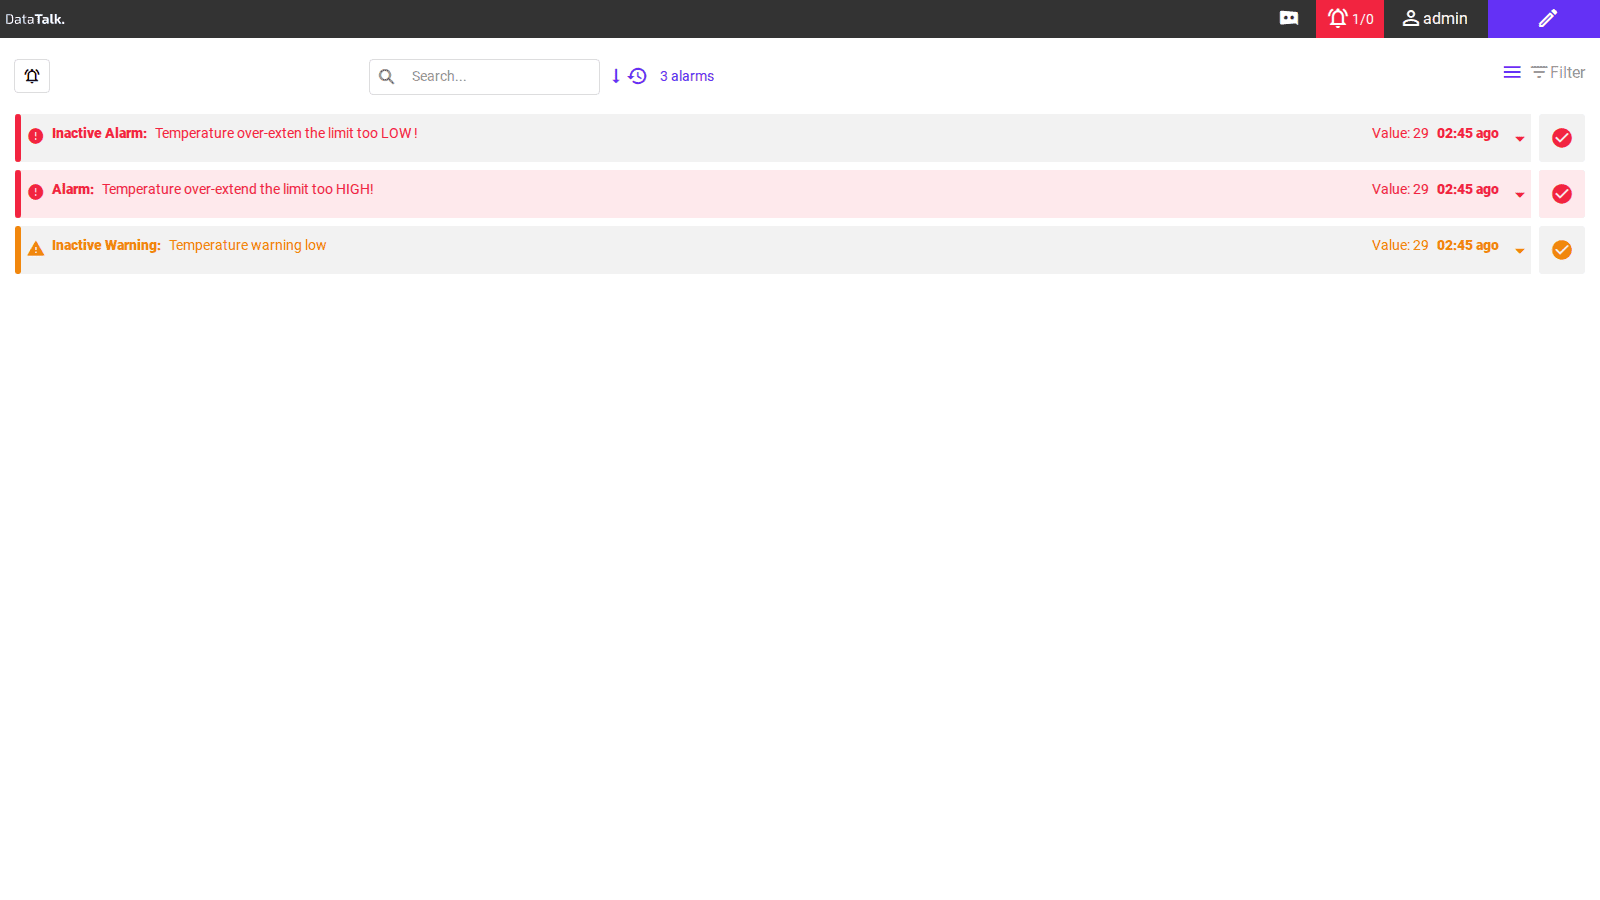
Operators see the live alarm list in View Mode. The alarm counter in the top bar updates in real time, and the AI assistant is available to answer questions about anything the system is monitoring.