
Alarms
The Alarms page displays a live list of all alarm conditions — both active and recently inactive. It is accessible at any time by clicking the alarm counter in the top bar.
Alarm counter in the top bar
The alarm counter uses the format active/confirmed — two numbers separated by a slash.
active — the number of alarms currently unacknowledged (red badge).
confirmed — the number of active alarms that have been acknowledged but whose value has not yet returned to normal.
For example, a counter showing 1/0 means one active alarm is waiting to be acknowledged, and zero acknowledged alarms are still in an alarm state.
Clicking the counter opens the Alarms page.
The live alarm list
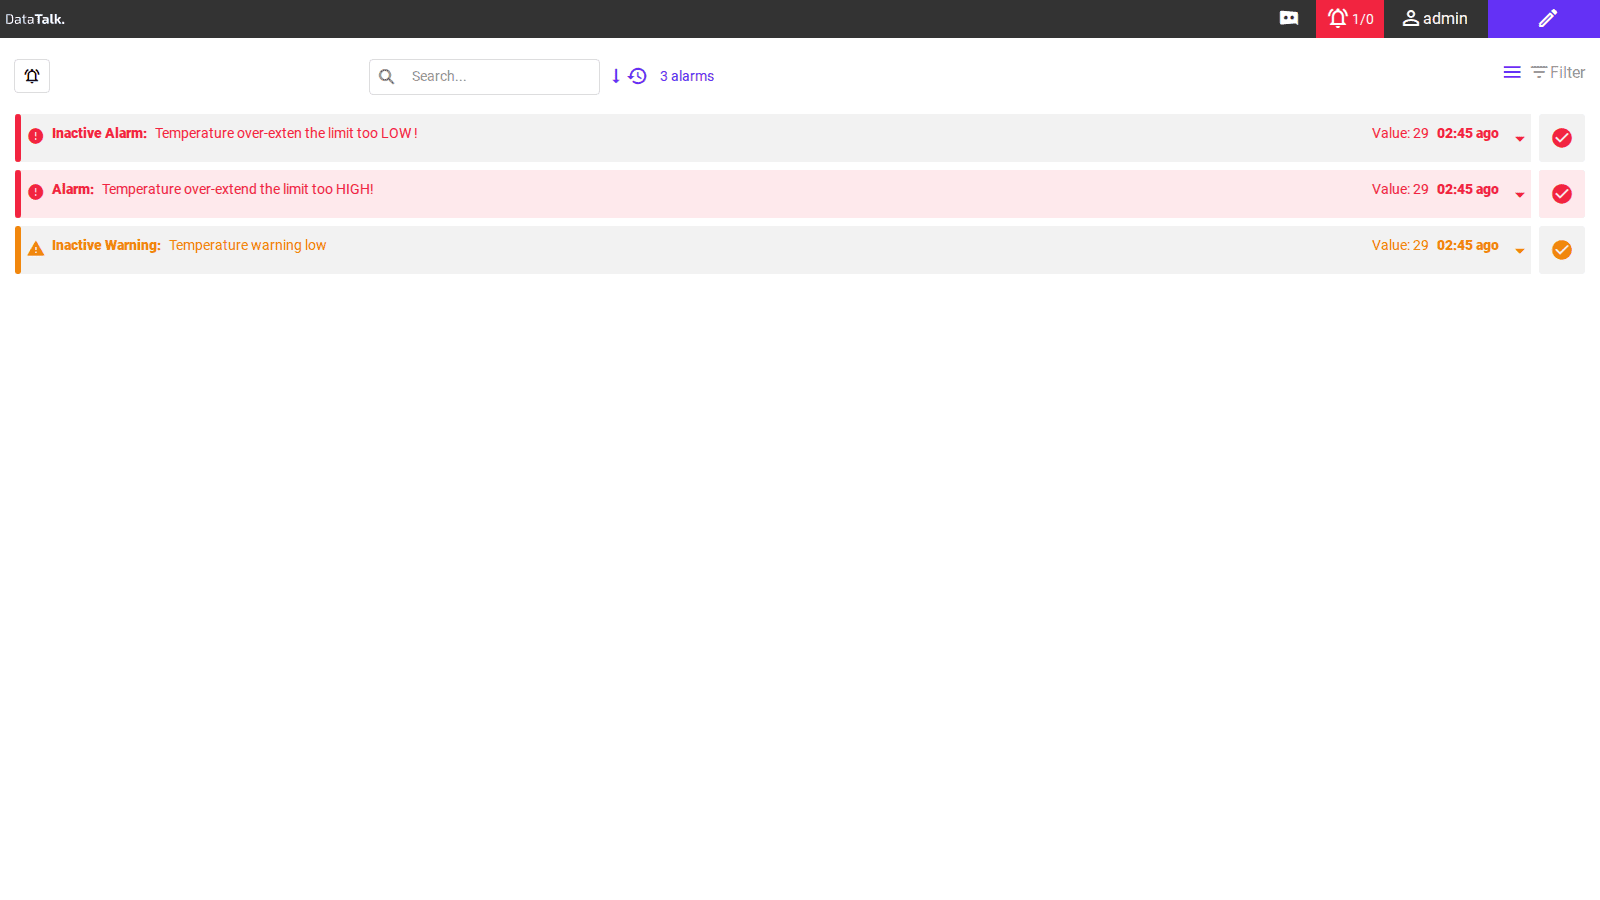
The Alarms page shows all current and recently triggered alarms in a scrollable list. Each row displays the alarm label, the tag value at trigger time, how long ago the alarm occurred, and action buttons.
Visual states
Each alarm row has a visual appearance that reflects its current state.
Alarm: — the tag value is currently exceeding the configured threshold and the alarm has not been acknowledged. The row has a red or pink background with a red circle icon.
Inactive Alarm: — the alarm was triggered but the tag value has since returned to normal. The alarm has not been acknowledged. The row has a grey background with a red circle icon.
Inactive Warning: — a warning-level threshold was reached but the value is no longer in the warning range. The row has a white background with an orange or yellow triangle icon.
Row controls
Each alarm row includes two controls on the right side.
Expand arrow — a chevron button that expands the row to reveal additional detail about the alarm condition.
Acknowledge button — a circular checkmark button. Clicking it acknowledges the alarm and moves it from the unacknowledged (active) count to the confirmed count in the top bar counter.
Search and Filter
The toolbar above the alarm list includes search and filter controls.
Search bar — type a tag name or alarm description to narrow the list to matching entries.
Filter button — opens filter options to limit which alarms are shown, for example by state or severity.
The toolbar also displays a total count such as 3 alarms to show how many entries are currently visible.
Edit Mode — Alarms view
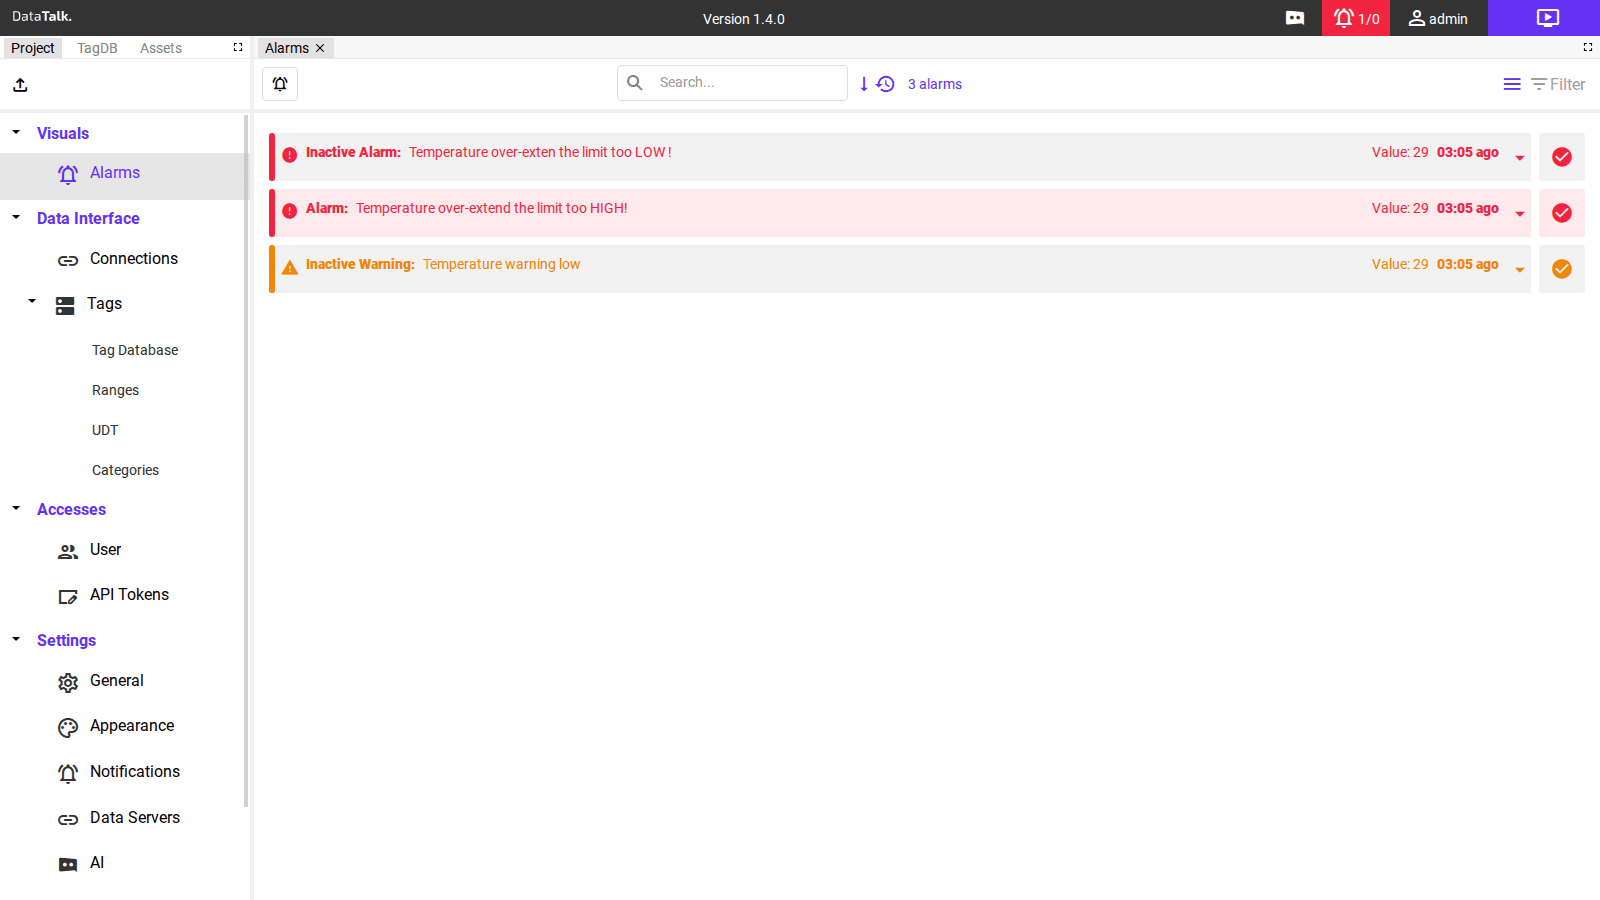
The Alarms panel is also visible in Edit Mode under Visuals → Alarms. It shows the same live alarm list as View Mode and is a monitoring view, not a configuration interface.
Alarms are generated when a tag value crosses a configured threshold. Threshold limits are defined in Edit Mode under Data Interface → Tag Database → Limits. No alarms will appear until at least one tag has a limit configured.